Geographical Clustering
Normal Geographical Clustering
- By default, during the Route Plan optimization process, the system aims to satisfy an ultimate goal that is to minimize the delivery cost as much as possible. However, this might often lead to the scenario in which the Delivery Routes of the Vehicles overlap with each other, as can be seen below:
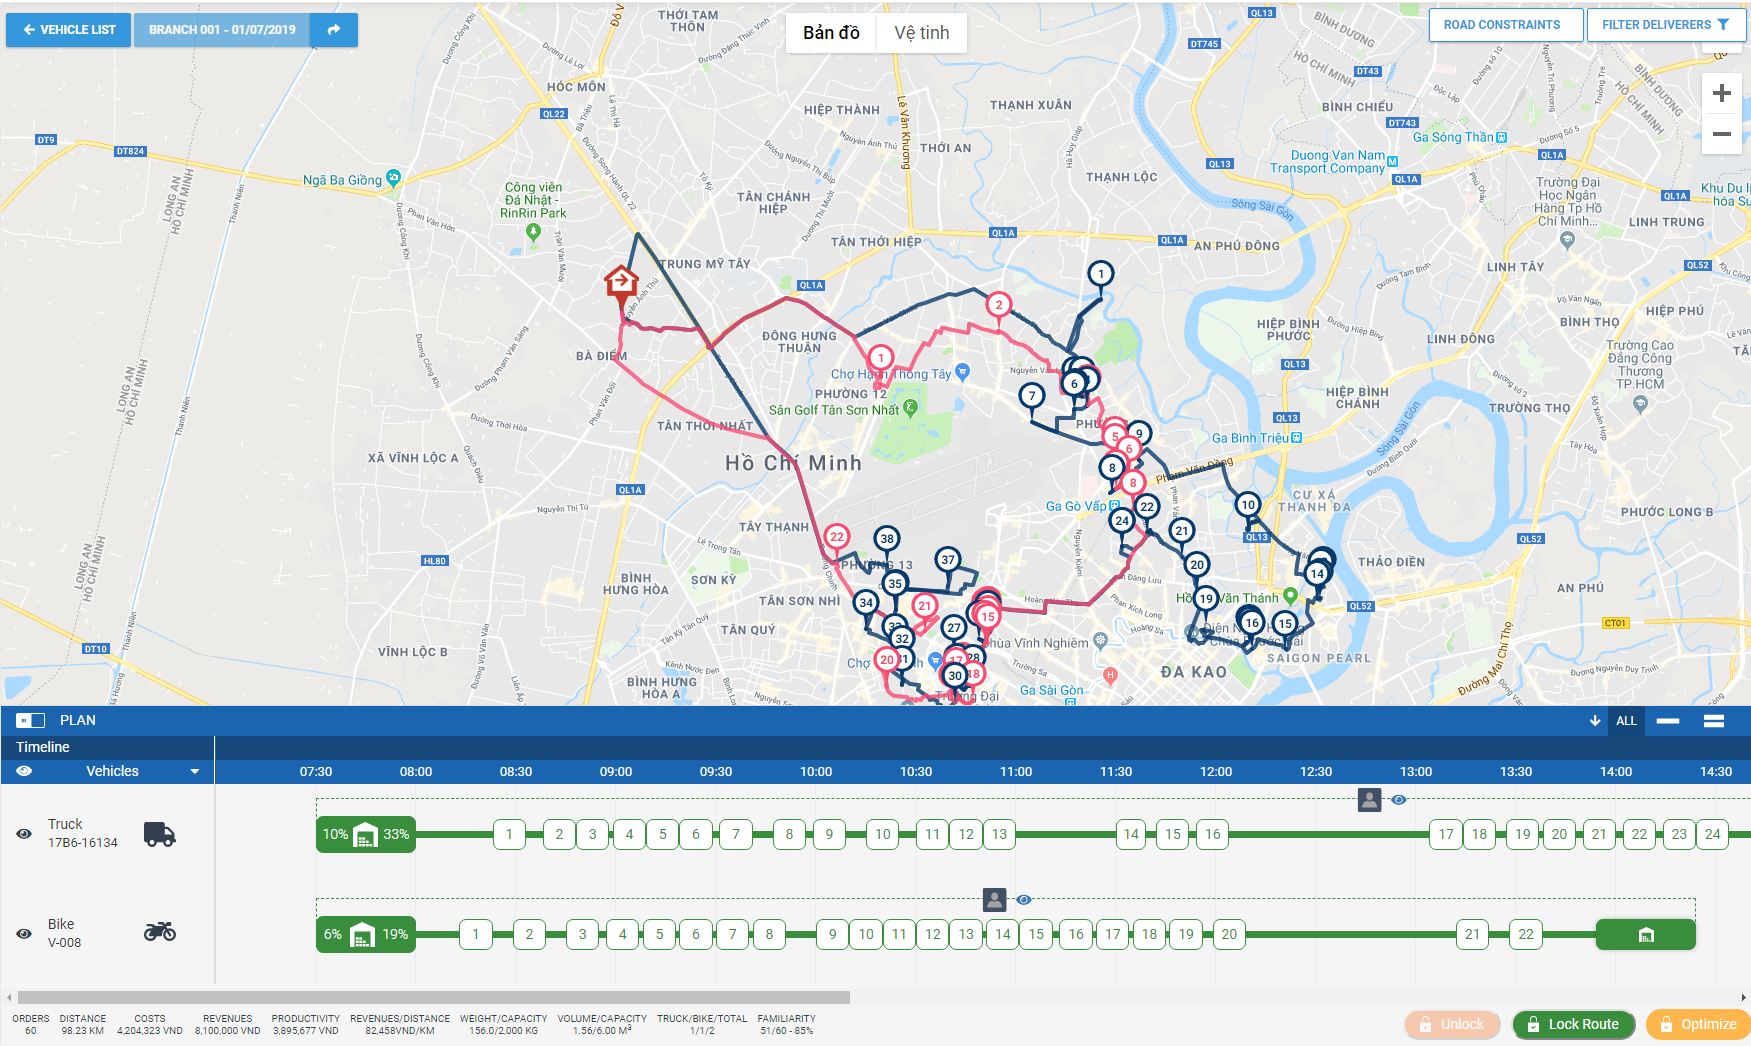
- To reduce the overlapping-ness of the Vehicles' Delivery Routes, you can use the Geographic Clustering configuration. This configuration will group customers into separate Geographic clusters and allocate these clusters to the delivery fleet accordingly
- First, you need to enable the following configuration at the Branch: Use Clustering (Auto). Then you can proceed to create orders and optimize routes as usual
- Below is an example of the delivery routes of two vehicles, before and after enabling the Geographic Clustering configuration
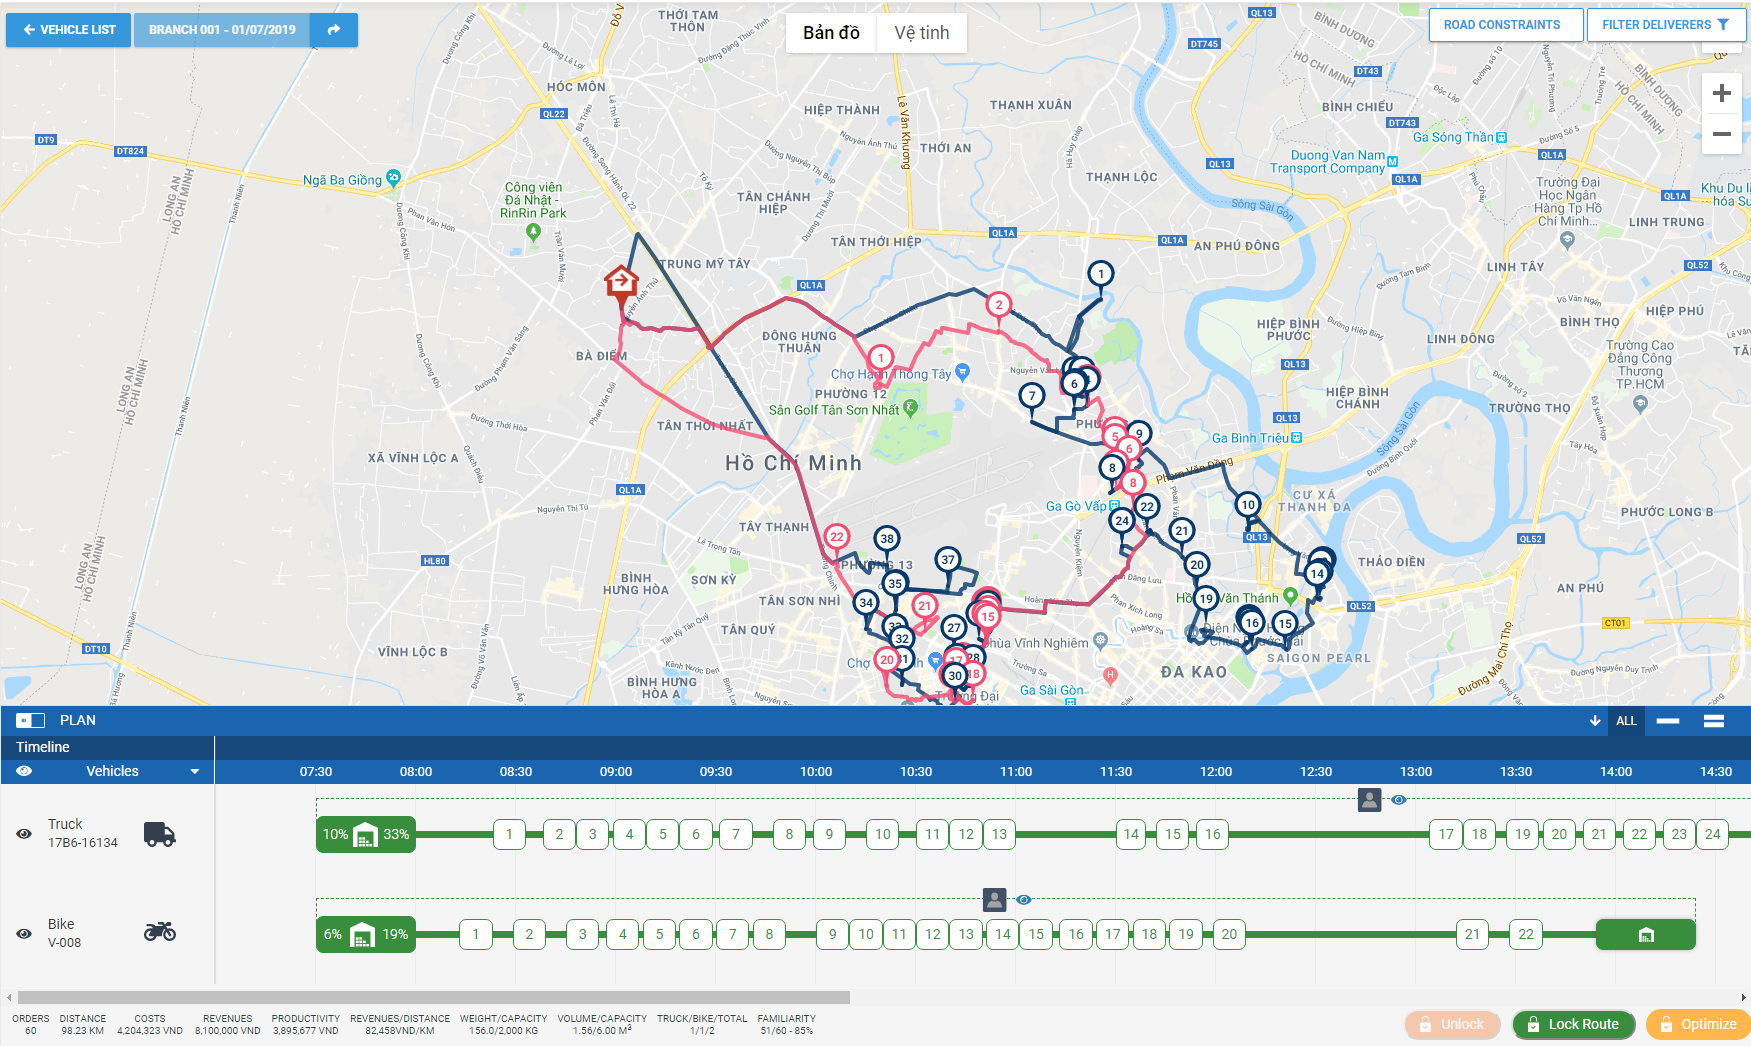
Optimized routes before enabling Geographic Clustering configuration
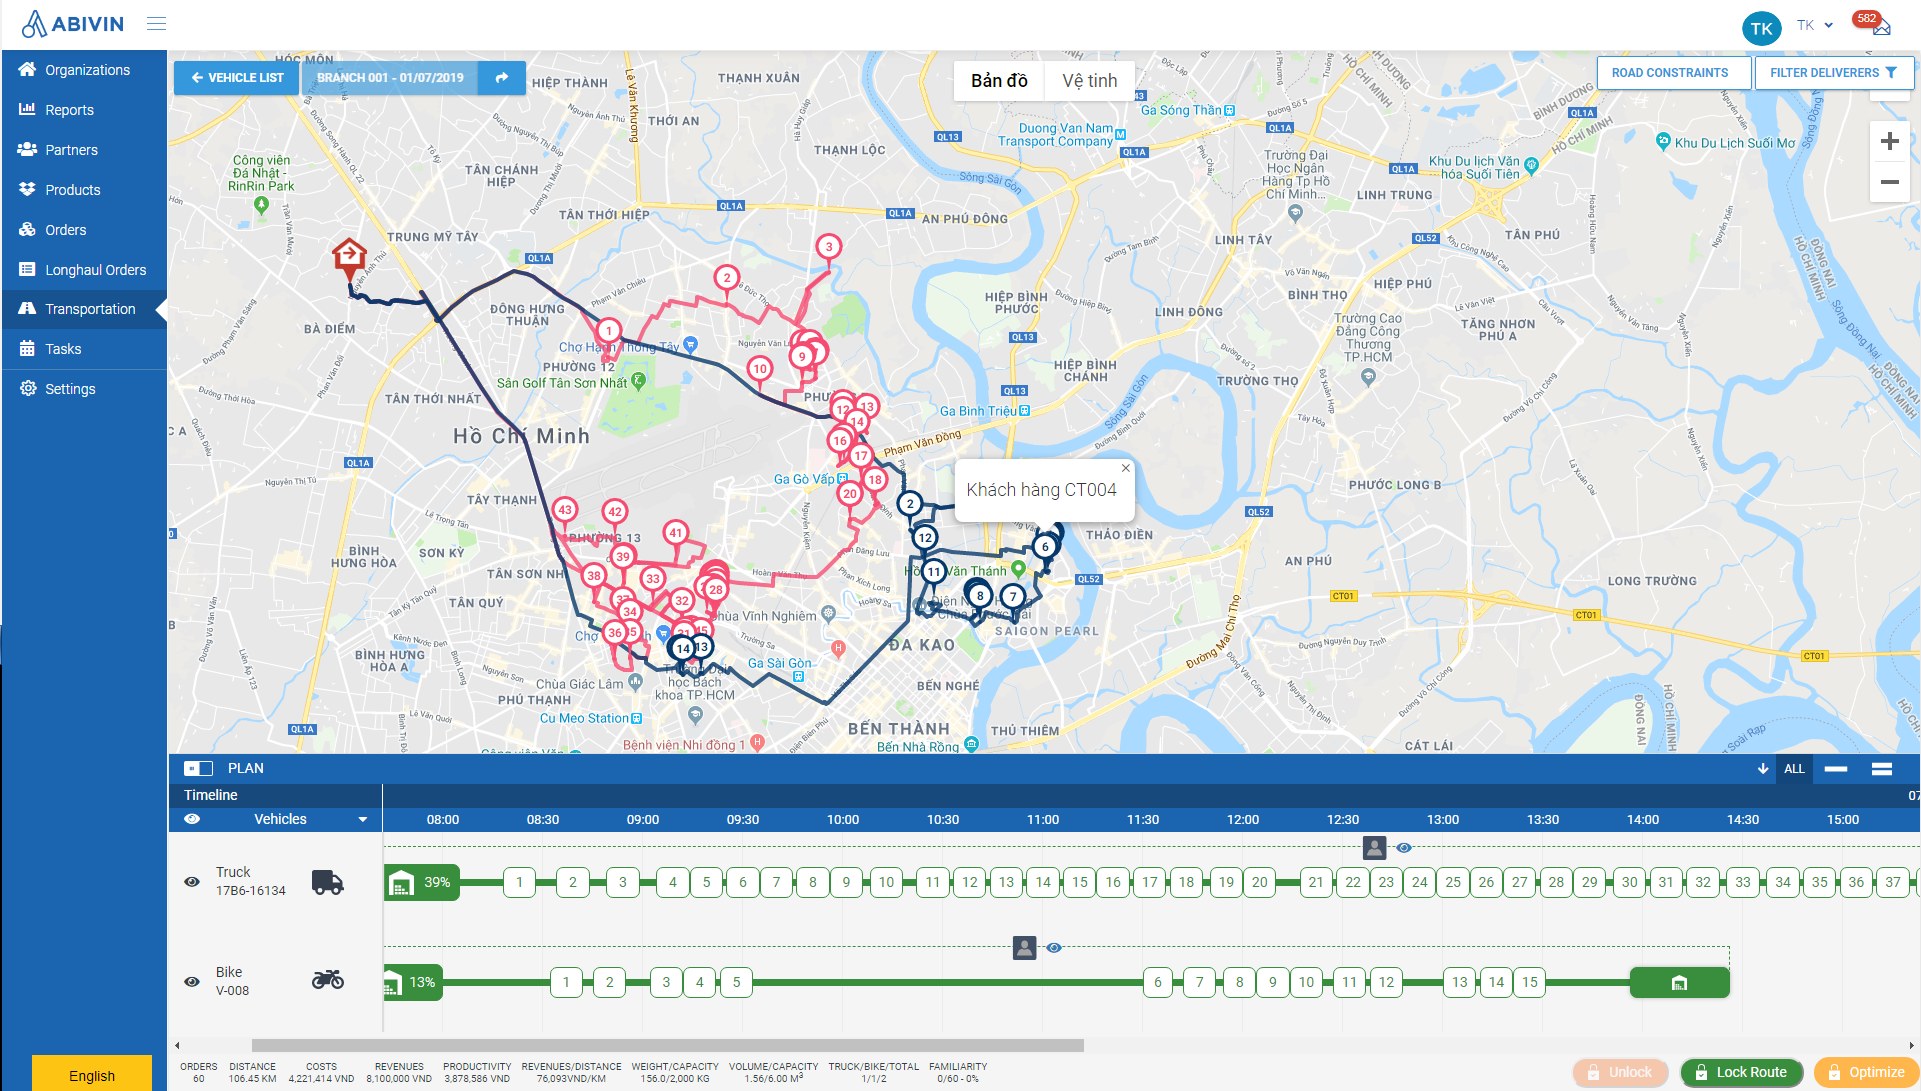
Optimized routes after enabling Geographic Clustering configuration
- Please note that if you use this configuration, the routing algorithm will reduce the overlaps that may occur between the Delivery Routes of the vehicles. However, the total delivery cost is likely to be higher than before
Geographical Clustering by Hanoi Districts
This feature is currently developed for certain User accounts only, and only applies to districts of Hanoi, Vietnam
Geographical Clustering By Administrative Divisions
- In many organizations, the delivery fleet is allocated based on administrative divisions (Province, District, Ward, etc.). A Vehicle will only deliver to the Customers located within certain administrative divisions. This can help reduce the overlapping-ness between the Vehicles' Delivery Routes. This section will help you achieve that in the Abivin vRoute system
A few things to note
- At the moment, this feature has only been developed to fully support the administrative divisions of Vietnam (Mostly optimized for the Southern Vietnam area to be more specific). For other countries, this feature is still useable, however, some setup steps will require more manual input by the users
- This feature doesn't work in accordance with the Geographic Clustering by Districts feature mentioned above
Geographical Clustering By Administrative Divisions Compulsory Configurations
- To use the Geographical Clustering by Administrative Divisions feature during the Route Plan optimization process, you will need to prepare the following things first (Click on the text to quickly jump to the content):
- 1 - Enable the Use Clustering configuration at the Branch
- 2 - Create the Customer Groups based on the administrative divisions
- 3 - Allocate the Customers into their respective administrative division based Customer Groups
Enable The Use Clustering Configuration At The Branch
- Navigate to the Organizations > Organizations tab
- Click the Edit icon of the Branch
- On the Update Organization form, navigate to the More Configurations > Algorithm sub-tab. Scroll down and tick the Use Clustering checkbox
- Upon ticking this checkbox, the Cluster section will appear below along with several radio boxes, indicating the administrative division level that you can apply:
- By Province: Generate geographical clusters based on the Province/City administrative division level
- By District: Generate geographical clusters based on the District administrative division level
- By Town: Generate geographical clusters based on the Ward/Commune administrative division level
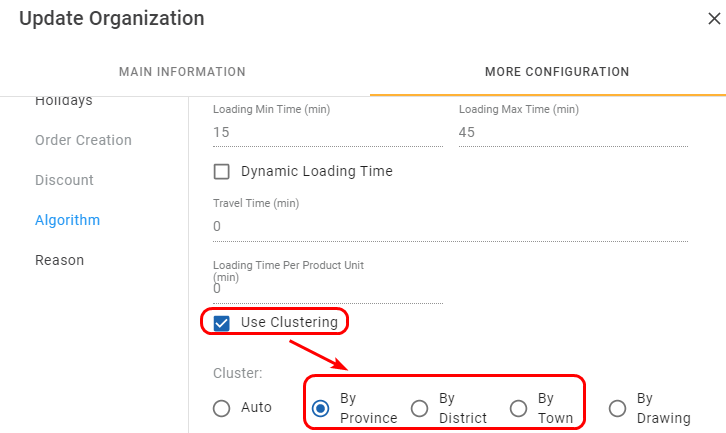
Illustration (English)
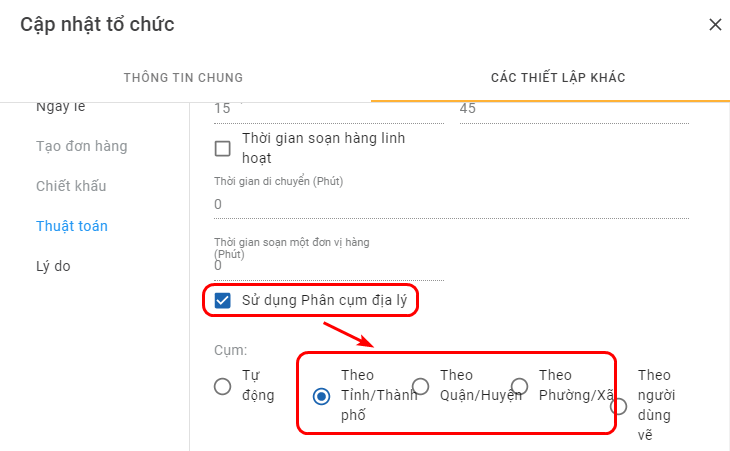
Illustration (Vietnamese)
The Auto and By Drawing radio boxes are not part of the Geographical Clustering by Administrative Divisions feature and thus will not be covered in this section
- After selecting the appropriate administrative division level, notice there is an additional field Max number of Associated Partner Groups appearing right below the radio boxes. This field lets you specify the maximum number of the Customer Groups (Of Multi-associated type) that can be put on one Delivery Trip of a Vehicle during the Route Plan optimization process
- Note that the value input here must be greater than 2 and smaller than 200
- For example, if you input the value 3 into this field, then, during the Route Plan optimization process, the system will put the Customers of up to three Multi-associated Customer Groups into each Delivery Trip of the utilized Vehicles

Illustration (English)
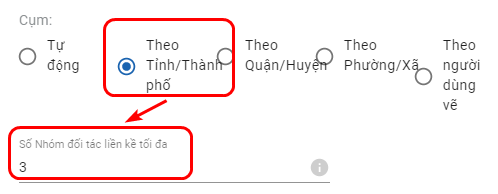
Illustration (Vietnamese)
- After you have selected the administrative division level and specify the maximum number of associated Customer Groups, click Save to confirm the changes
Create Administrative Division Based Customer Groups
- The next step is to create the Customer Groups based on the administrative division level that you have just configured at the Branch
- There are two methods to create the Customer Groups (Click on the text to quickly jump to the content): Webform and Excel import file
Create Geographical Clustering Customer Groups Using The Webform
- Navigate to the Partners > Customer Groups tab
- Open the Webform to create the Customer Group
- As you select the Depot under the Branch at which the Geographical Clustering by Administrative Division configuration is enabled, notice the field Group Cluster will display the administrative division level which you have selected earlier
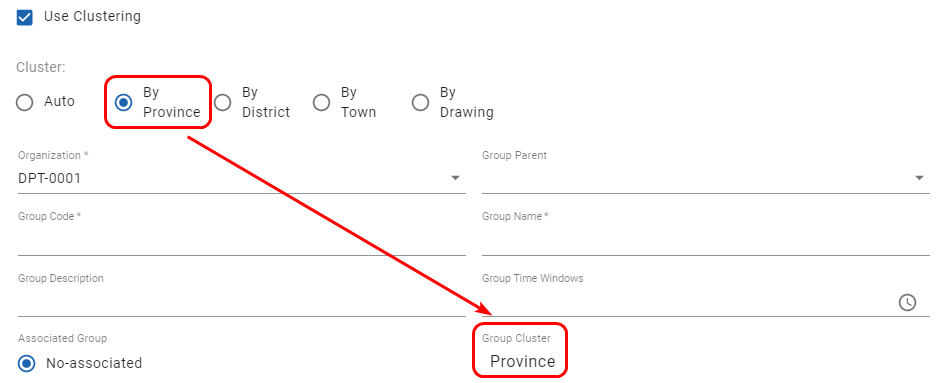
Illustration (English)
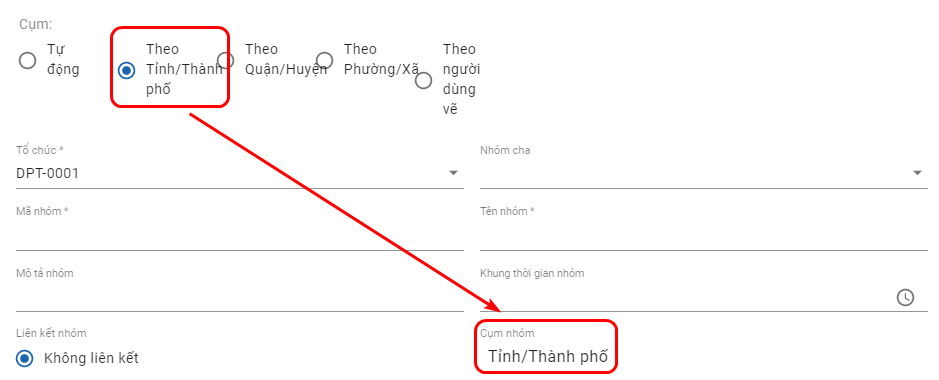
Illustration (Vietnamese)
- (For Vietnamese Users) At the same time, the Clustering by section will appear below
- If the selected administrative division level is Province then only the Province column is visible
- If the selected administrative division level is District then the Province and District columns are visible
- If the selected administrative division level is Town then all three columns Province, District; Town are visible
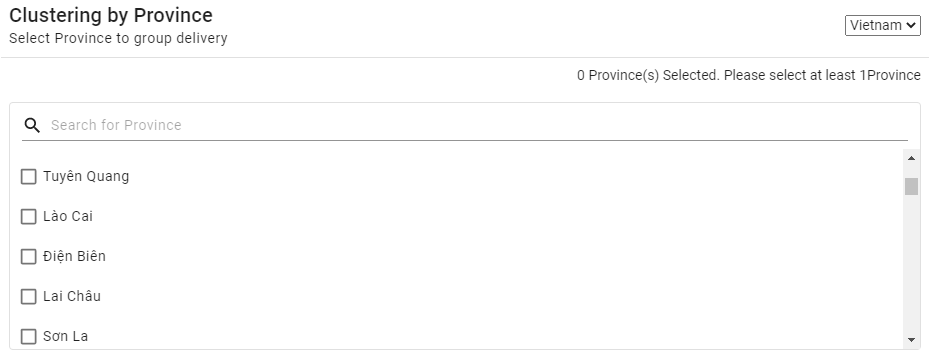
Illustration (English)
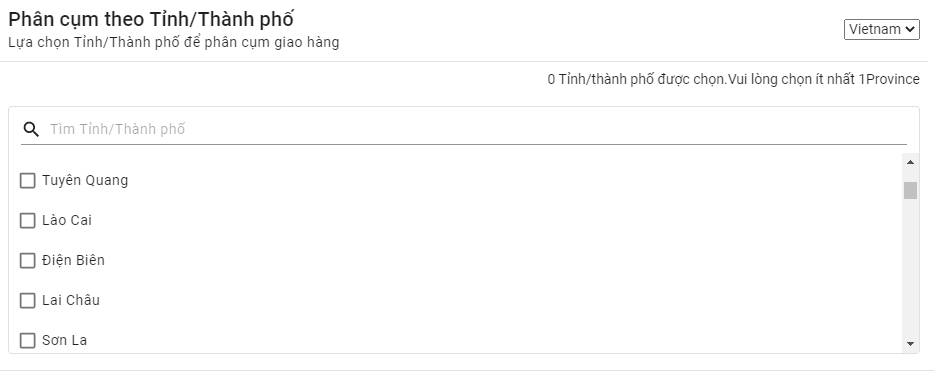
Illustration (Vietnamese)
- To select a Province, input the Province name into the search field, then tick its corresponding checkbox. You can select multiple Provinces or tick the checkbox All Province to select all Provinces
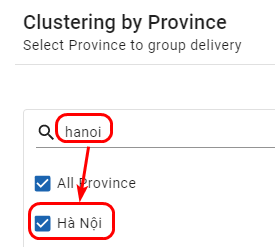
Illustration (English)
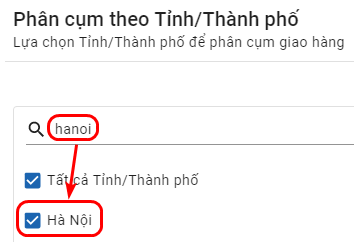
Illustration (Vietnamese)
- After you have selected the Provinces/Cities, the District column (If visible) will refresh and display all the Districts within the selected Provinces/Cities. Perform the same steps to select the Districts. Similarly, after the Districts are selected, the Town column (If visible) will refresh and display all the Wards/Communes within the selected Districts. Perform the same steps to select the Wards/Communes
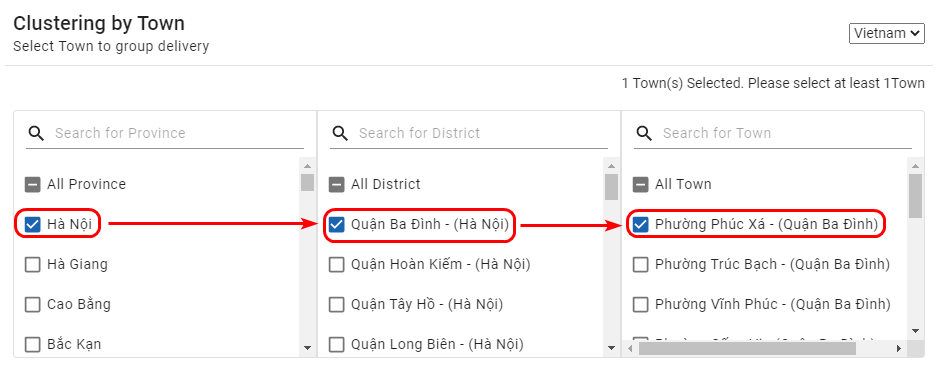
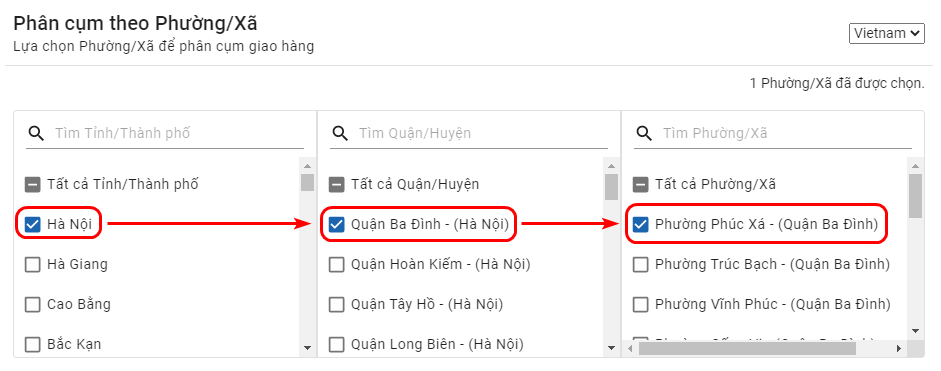
Illustration (Vietnamese)
- For users not based in Vietnam, at the moment, the Clustering by section will not show the administrative divisions of your countries, therefore you do not need to pay attention to that section. What you will need to do now is to list out the number of geographical clusters that your organization currently uses when planning the delivery plan then create the equivalent number of Customer Groups on the Abivin vRoute system
Create Geographical Clustering Customer Groups Using The Excel Import File
Only applicable to Vietnam administrative divisionsAt the moment, the content below is only applicable to the Vietnam administrative divisions. For other countries, you simply need to list out the number of geographical clusters that your organization currently uses when planning the delivery plan then create the equivalent number of Customer Groups
- When you use the Excel import file to create the Customer Groups, first you need to take note of the administrative division level applied to the upper-level Branch of that Depot on the Web app, then input the correct administrative division level into the Clustering Group Type cells of the Customer Groups in the Excel import file. There can be three scenarios (Click on the text to quickly jump to the content):
- Scenario 1: Customer Group By Province/City Administrative Division Level
- Scenario 2: Customer Group By District Administrative Division Level
- Scenario 3: Customer Group By Ward/Commune Administrative Division Level
Customer Group By Province/City Administrative Division Level
- If the administrative division level on the Web app is By Province, follow the steps below when inputting the Customer Group information in the Excel import file:
- 1 - Input the exact following value (In English, including uppercase and lowercase letters) into the Clustering Group Type cell of the Customer Group being created: By Province
- 2 - Input the name of the appropriate province/city name into the Customer Group's Province cell. Leave the Customer Group's District; Town cells blank
- If the Customer Group being created will cover the Customers located in multiple provinces/cities, you will need to input each province/city name on a separate row. Note that you will also need to copy and paste other common information of that Customer Group (Organization Code; Partner Group Code; Partner Group Name; Parent Group Code; Partner Group Type; Clustering Group Type; Group Description; Group Time Windows; Associated Group Code) on all of that Customer Group's rows

- Refer to the Administrative Division Name Input Rules section for the rules when inputting the administrative division names
Customer Group By District Administrative Division Level
- If the administrative division level on the Web app is By District, follow the steps below when inputting the Customer Group information in the Excel import file:
- 1 - Input the exact following value (In English, including uppercase and lowercase letters) into the Clustering Group Type cell of the Customer Group being created: By District
- 2 - Input the name of the appropriate province/city into the Customer Group's Province cell. Continue to input the name of the appropriate district into the Customer Group's District cell. Leave the Customer Group's Town cell blank
- If the Customer Group being created will cover the Customers located in multiple provinces/cities and multiple districts within each province/city, you will need to input each district name on a separate row. Note that you will also need to copy and paste other common information of that Customer Group (Organization Code; Partner Group Code; Partner Group Name; Parent Group Code; Partner Group Type; Clustering Group Type; Group Description; Group Time Windows; Associated Group Code; Province) on all of that Customer Group's rows

- Refer to the Administrative Division Name Input Rules section for the rules when inputting the administrative division names
Customer Group By Ward/Commune Administrative Division Level
- If the administrative division level on the Web app is By Town, follow the steps below when inputting the Customer Group information in the Excel import file:
- 1 - Input the exact following value (In English, including uppercase and lowercase letters) into the Clustering Group Type cell of the Customer Group being created: By Town
- 2 - Input the name of the appropriate province/city into the Customer Group's Province cell. Continue to input the name of the appropriate district and ward/commune into the Customer Group's District and Town cells
- If the Customer Group being created will cover the Customers located in multiple provinces/cities, multiple districts, and multiple ward/communes, you will need to input each ward/commune name on a separate row. Note that you will also need to copy and paste other common information of that Customer Group (Organization Code; Partner Group Code; Partner Group Name; Parent Group Code; Partner Group Type; Clustering Group Type; Group Description; Group Time Windows; Associated Group Code; Province; District) on all of that Customer Group's rows

- Refer to the Administrative Division Name Input Rules section for the rules when inputting the administrative division names
Administrative Division Name Input Rules
- You can input the province/city/district/ward/commune name with or without tone marks. For example, Hà Nội; Cần Thơ or Ha Noi; Can Tho are both valid
- You CANNOT input the province/city/district/ward/commune name without spaces. For example, Hanoi; Cantho are not valid
- For Ho Chi Minh city, you need to input the exact following two values Ho Chi Minh or Hồ Chí Minh. DO NOT input other values such as Ho Chi Minh city; Tp Ho Chi Minh or Sai Gon/Sài Gòn
Allocate Customers Into Administrative Division Based Customer Groups
- During the Customer creation/editing process, you need to move them into the correct Customer Groups based on the administrative divisions
- We will instruct you how to allocate the Customers into their appropriate administrative division based Customer Groups using the Webform and the Excel import file (Click on the text to quickly jump to the content)
Allocate Customers Into Administrative Division Based Customer Groups Using The Webform
- If you use the Webform to create the Customers, follow the instruction below to allocate the Customers into their appropriate administrative division based Customer Groups
- 1 - Select the Depot under the Branch at which the Geographic Clustering configuration has been enabled
- 2 - Scroll down the Webform to the Address Setting section. Click on the Abivin icon to the right of the Search Address field. Upon clicking, a drop-down list that reads Get Address from will appear. This is where you can select the map engine to use between the Abivin vRoute built-in map engine and the Google Map engine. Click on the desired map engine icon to select it
The Abivin vRoute engine database is more optimized than the Google Map engine for complex address values, especially in the Southern area of Vietnam
- 3 - Input the address of the Customer into the Search Address field. After inputting, a drop-down list will appear right below this field and display the list of appropriate results. Click on the desired result to select it
- If you use the Abivin vRoute built-in map engine, then upon selecting the address result, the following information fields of the Customer being created will be automatically filled: Country; City; District; Town; Street Address. Do note that the coordinate information fields Latitude; Longitude will NOT be automatically filled. You will need to manually input the Customer coordinate information into those fields
- If you use the Google Map engine, then upon selecting the address result, the following information fields of the Customer being created will be automatically filled: Country; City; District; Town; Street Address; Latitude; Longitude
- At the same time, the system will find the appropriate Customer Group for the Customer based on the Customer address value then automatically update the Customer Group field
- For example, prior to creating the Customers, I have created a Customer Group that covers the Truc Bach ward, Ba Dinh district, Hanoi, Vietnam. When I create a Customer that locates in 16B Ngu Xa street, Truc Bach ward, Ba Dinh district, Hanoi, Vietnam, then, as I select the Customer address using either of the map engines above, the Customer Group field of this Customer will automatically select the Truc Bach ward Customer Group created earlier
Allocate Customers Into Administrative Division Based Customer Groups Using The Excel Import File
- In the Excel import file, if you wish to let the system automatically allocate the Customers into the appropriate administrative division-based Customer Groups, you will need to do the following things:
- 1 - Leave the Partner Group Code cells blank
- 2 - Input the correct, detailed address of the Customers into the Address field
- Upon importing the Excel file, the system will use the Abivin vRoute built-in map engine to extract the address value and fill in the following information fields of the Customers: Original Address; Country; City; District; Town as well as allocate the Customers into their appropriate administrative division-based Customer Groups
- Do note that similar to the Webform, you will need to manually input the coordinate information of the Customers into their respective Latitude; Longitude cells
- If in the Excel import file, apart from the Address field, you also input into the City/Province; Street Address; Town; District; Country fields, then upon importing the system will take these manually input values instead of extracting the value of the Address field to fill in the corresponding fields on the Webform. However, the system will still base on the Address value to select the appropriate Customer Groups
The feature to use the Google Map engine instead of the Abivin vRoute built-in map engine when importing the Excel file is only enabled for certain User accounts
Geographical Clustering By Administrative Divisions - Route Plan Optimization
- After the above steps have been done, you can create the Orders and perform the Route Plan optimization process as usual
- Let's look at the below illustration to understand this feature better
- The Branch is configured to cluster Customers by District. It is also configured so that a vehicle will deliver for no more than 2 Customer Groups per Deliver Trip

- A vehicle is assigned three Orders. Each Order is placed by a Customer from three different Customer Groups. Each Customer Group represents a District within a City
- Without the configuration Use Clustering (By District) enabled, the vehicle has enough capacity and therefore will deliver all three Orders in one single Delivery Trip
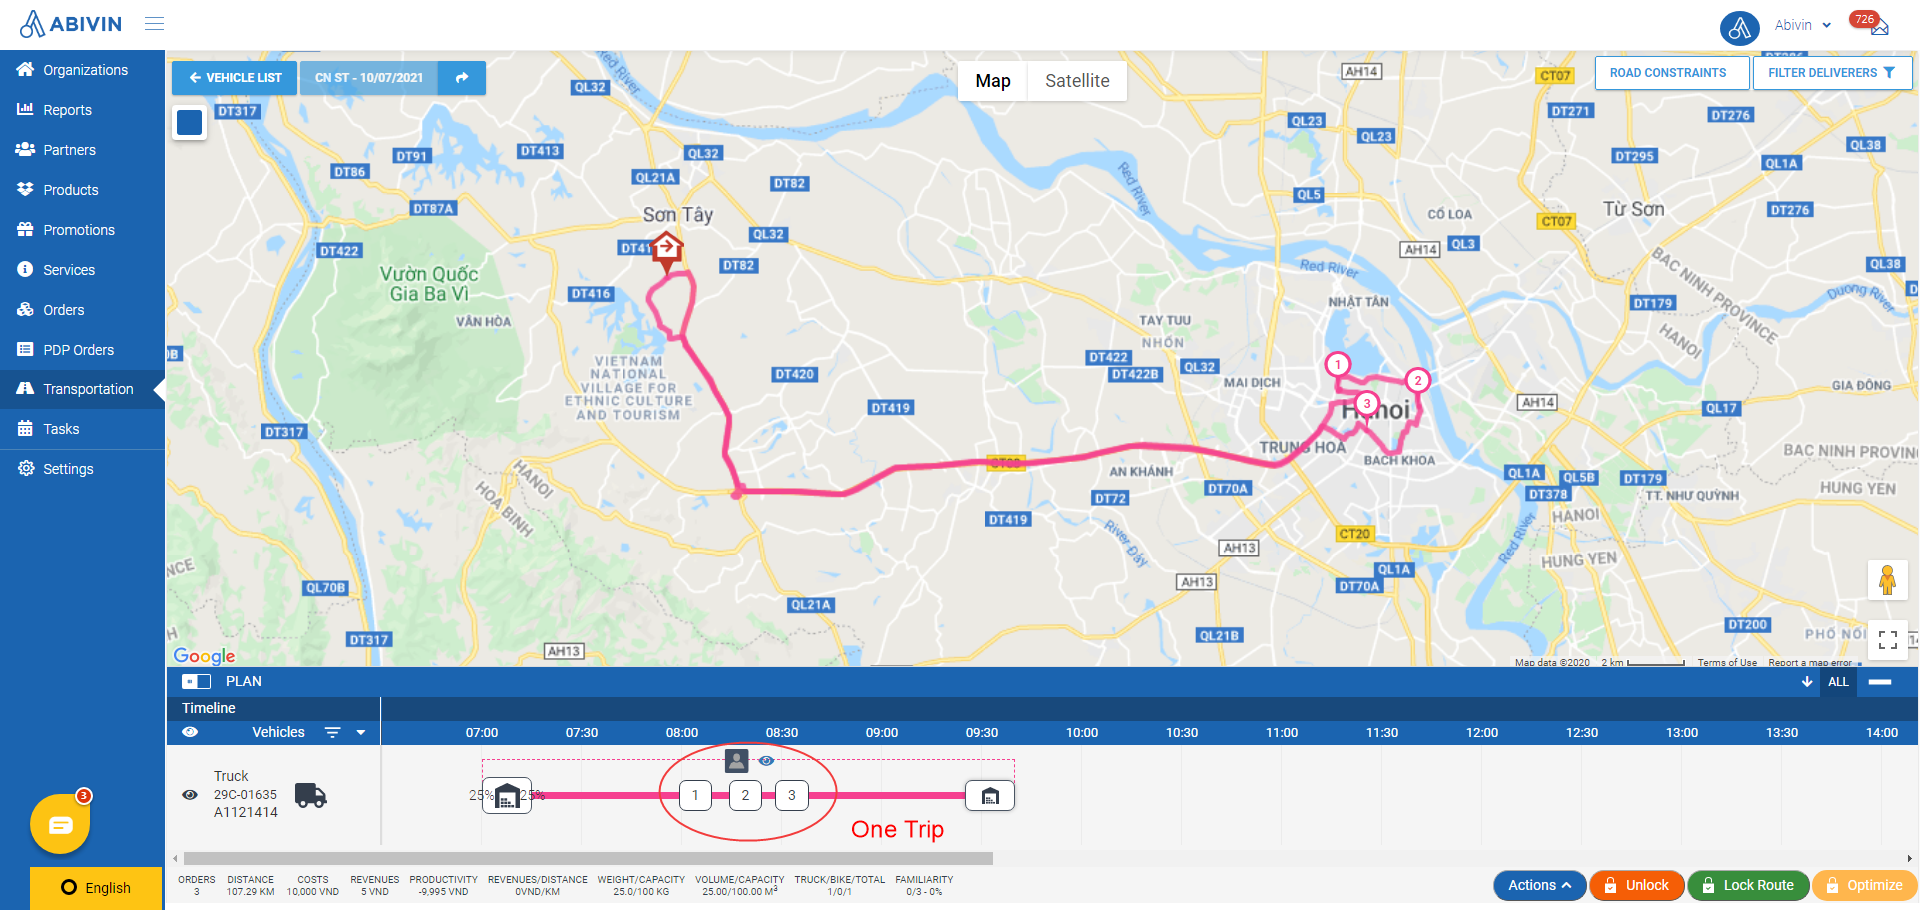
One single Delivery Trip
- With the configuration Use Clustering (By District) enabled, the vehicle, as mentioned above, can only deliver Orders for a maximum of two Customer Groups per Delivery Trip. The vehicle therefore will perform two consecutive Delivery Trips to deliver those three Orders
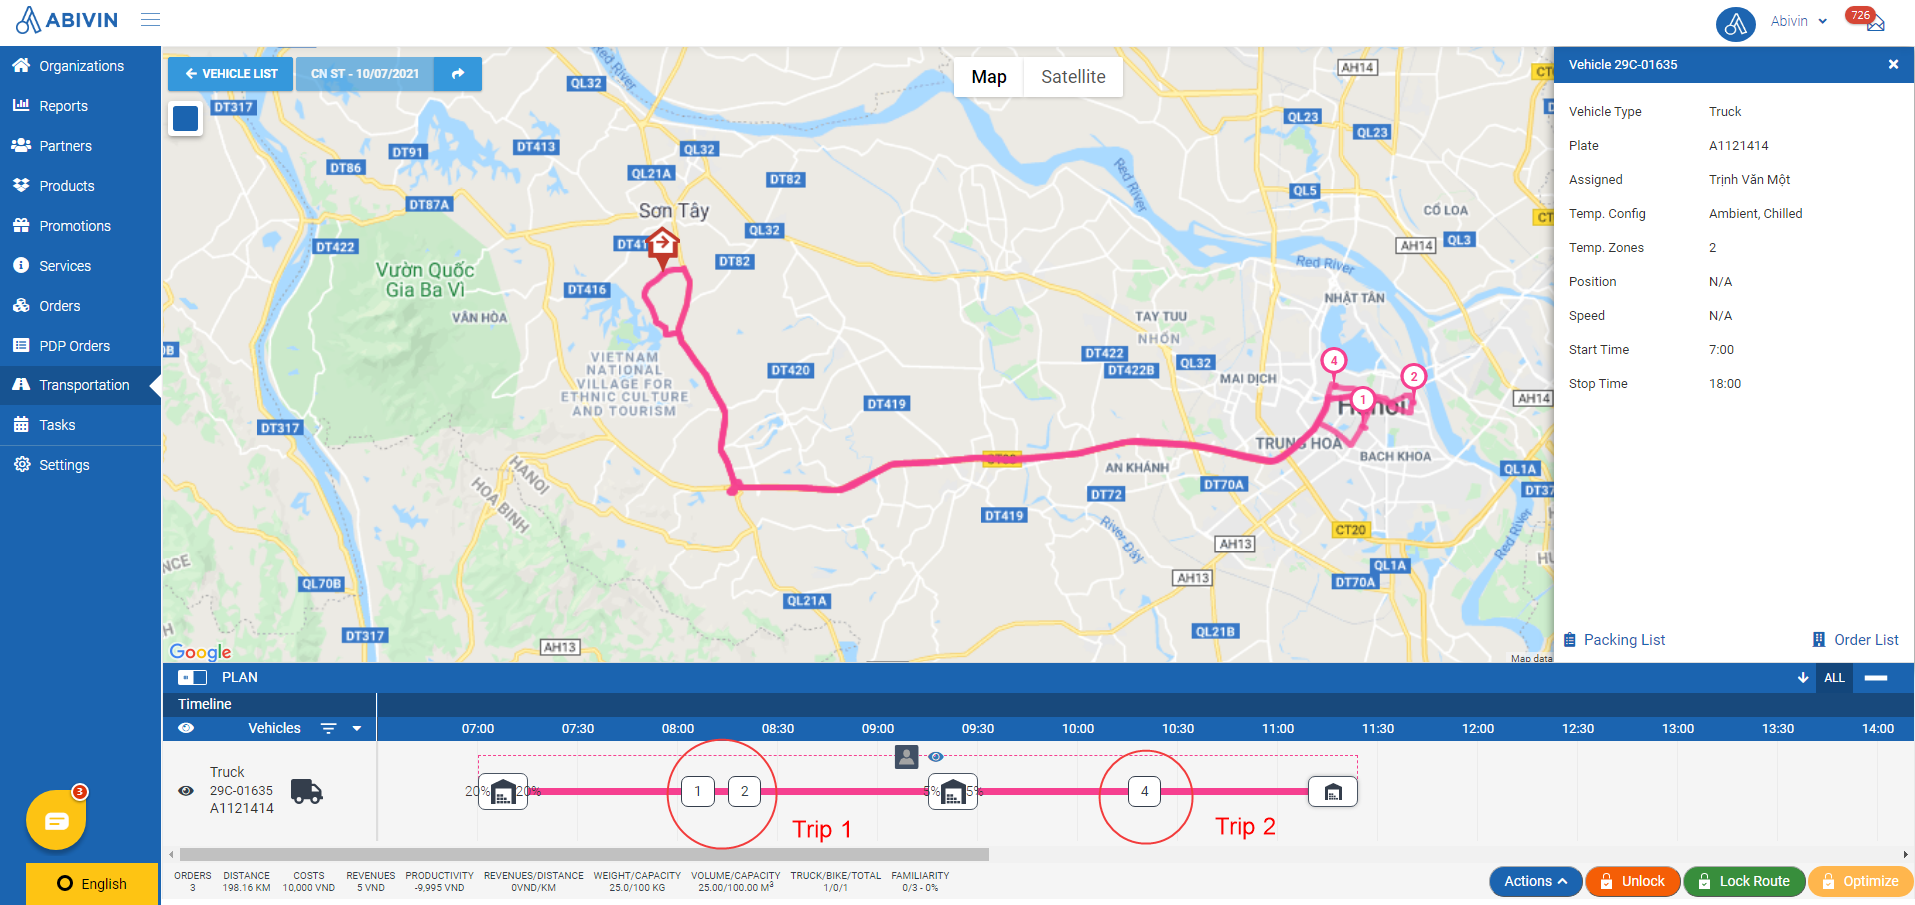
Two consecutive Delivery Trips
Geographical Clustering by User Drawing
- In actual operation, the route dispatchers might not necessarily plan the Delivery Routes based on the official administrative divisions (For example, plan a vehicle to deliver for a whole district). Instead, they will flexibly define the geographical clusters based on their actual experience, not being bound by the official administrative divisions
- In Abivin vRoute, users can use the Geographical Clustering by User Drawing function to fulfill this need
Compulsory Configurations
Enable Use Clustering (By Drawing) configuration
- You need to enable the Use Clustering (By Drawing) at the Branch. This configuration is located in the More Configuration > Algorithm section
- As you enable this configuration, the Max number of Associated Partner Groups and Minimum Vehicle Fill Rate (%) sub-configurations will appear below
- The Max number of Associated Partner Groups field lets you specify the maximum number of associated Customer Groups that the system can assign to a vehicle apart from the main Customer Group (Of Multi-associated type). Here you must input a positive integer value that is larger than or equal to 2
- The Minimum Vehicle Fill Rate (%) field lets you specify the minimum cargo space fill rate in percentage (In terms of both weight capacity and volume capacity) that the system will apply to the vehicles during the Route Plan optimization process. Here you must input a positive integer that is less than or equal to 100
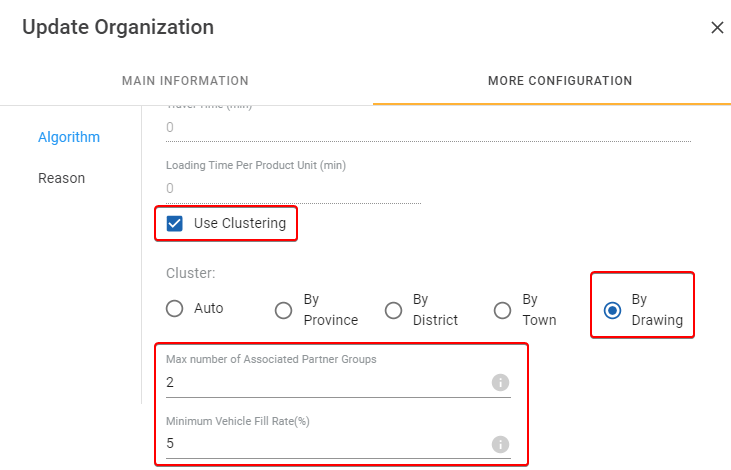
Illustration (English)
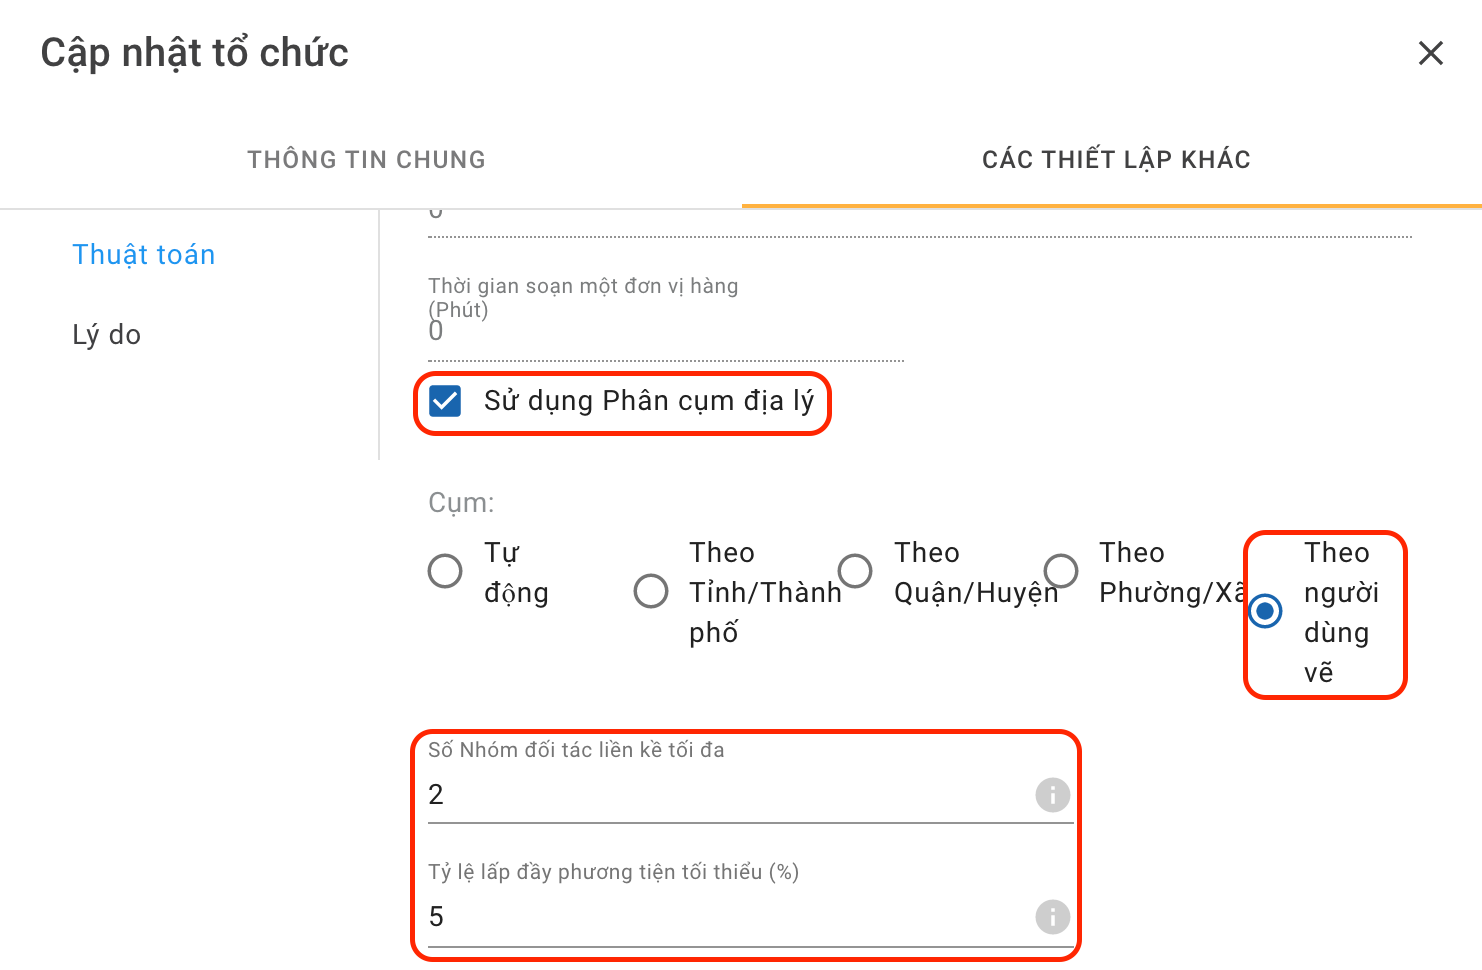
Illustration (Vietnamese)
Enable Hard Time Window configuration
- IMPORTANT At the moment, in order to run this geographical clustering configuration, you also need to enable the Hard Time Window algorithm configuration at the Branch (Located in the More Configurations > Algorithm section)
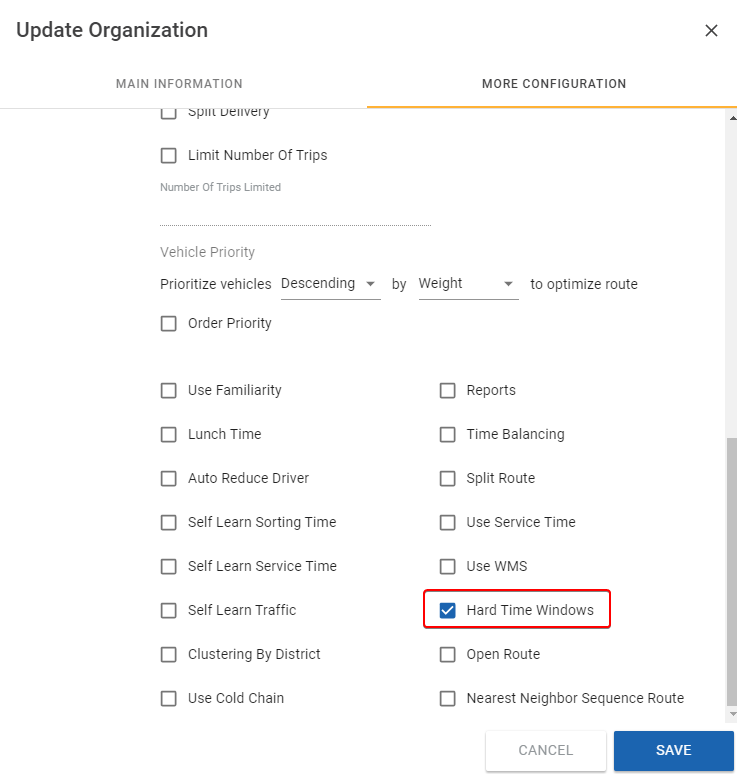
Illustration (English)
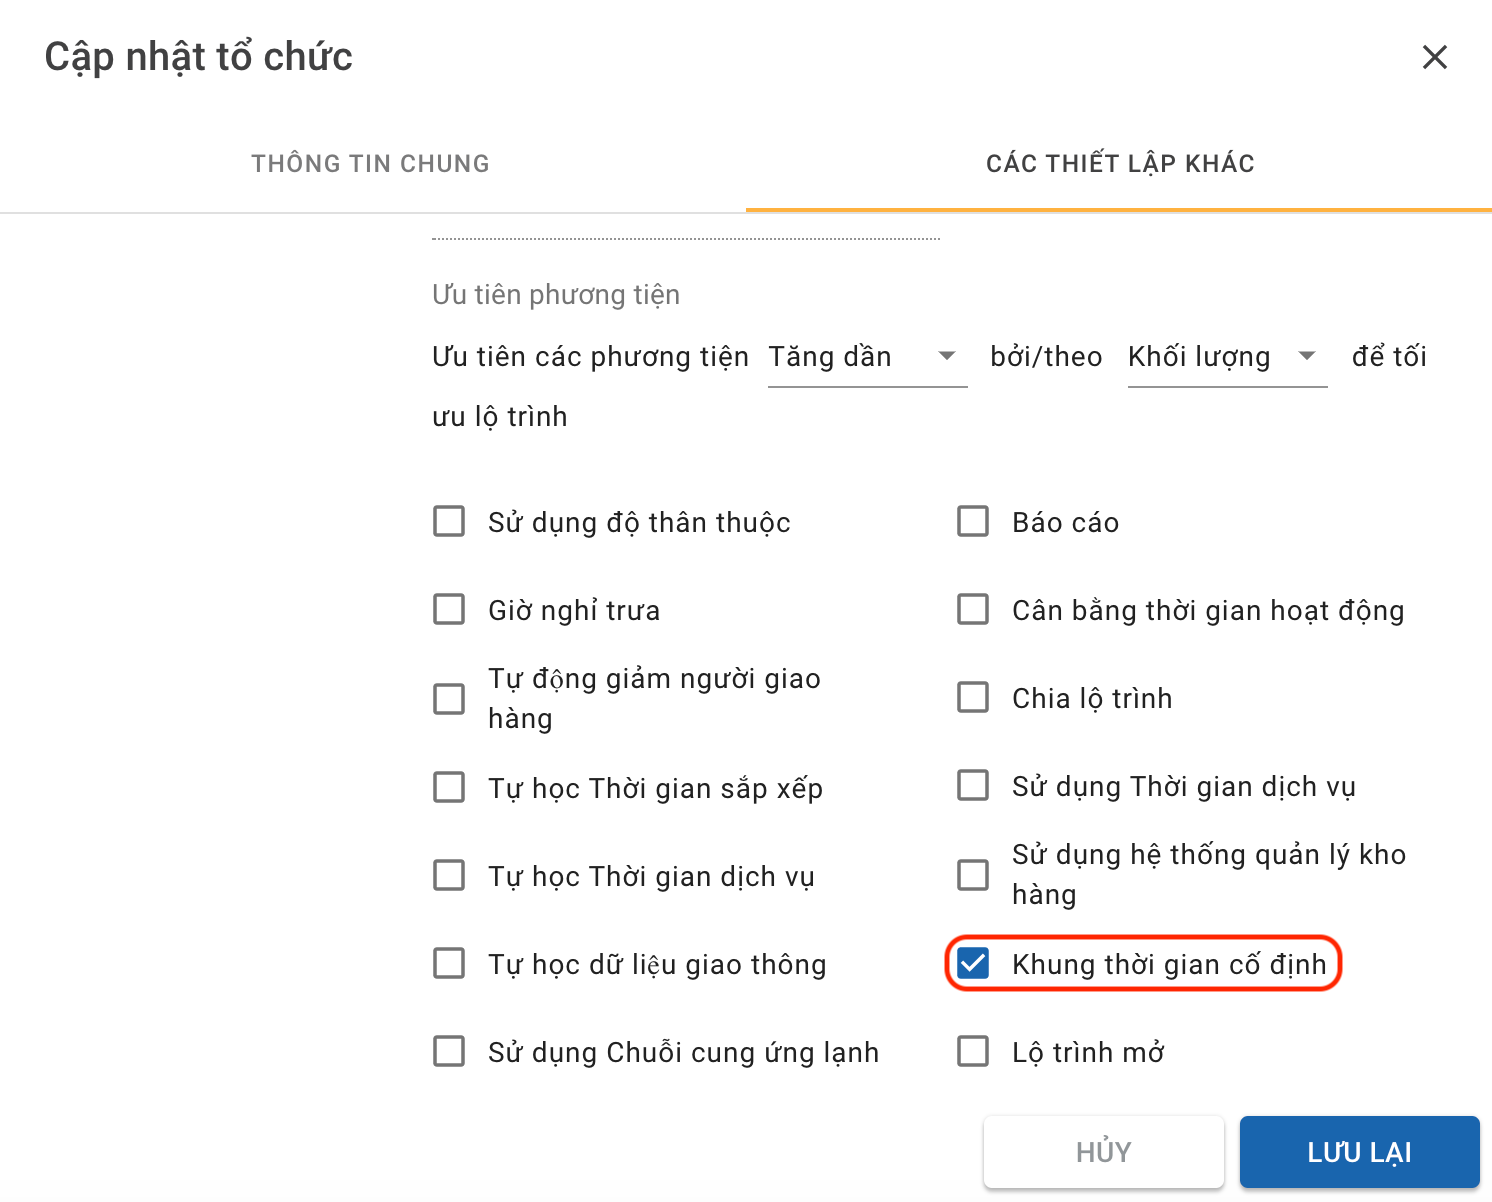
Illustration (Vietnamese)
(Optional) Enable Random Vehicle Seed configuration
- Optionally, you can also enable the Random Vehicle Seed configuration of the Branch (Located in the More Configuration > Route section). With this configuration enabled, the list of vehicle forwarded to the routing algorithm engine is randomized each time the Route Plan Optimization process is run
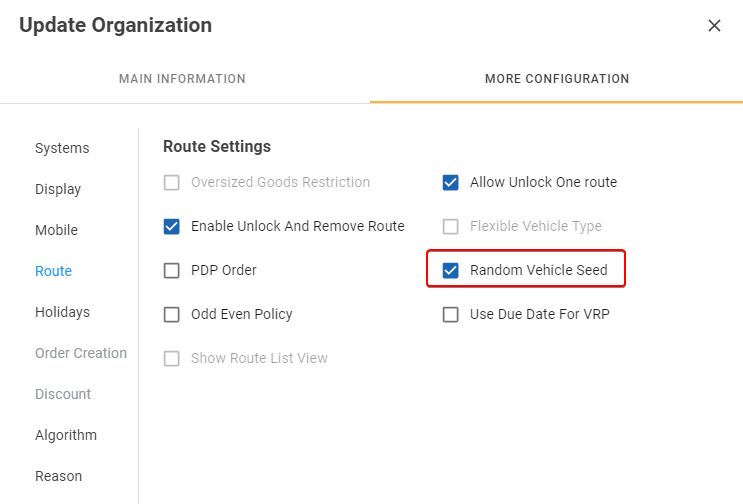
Illustration (English)
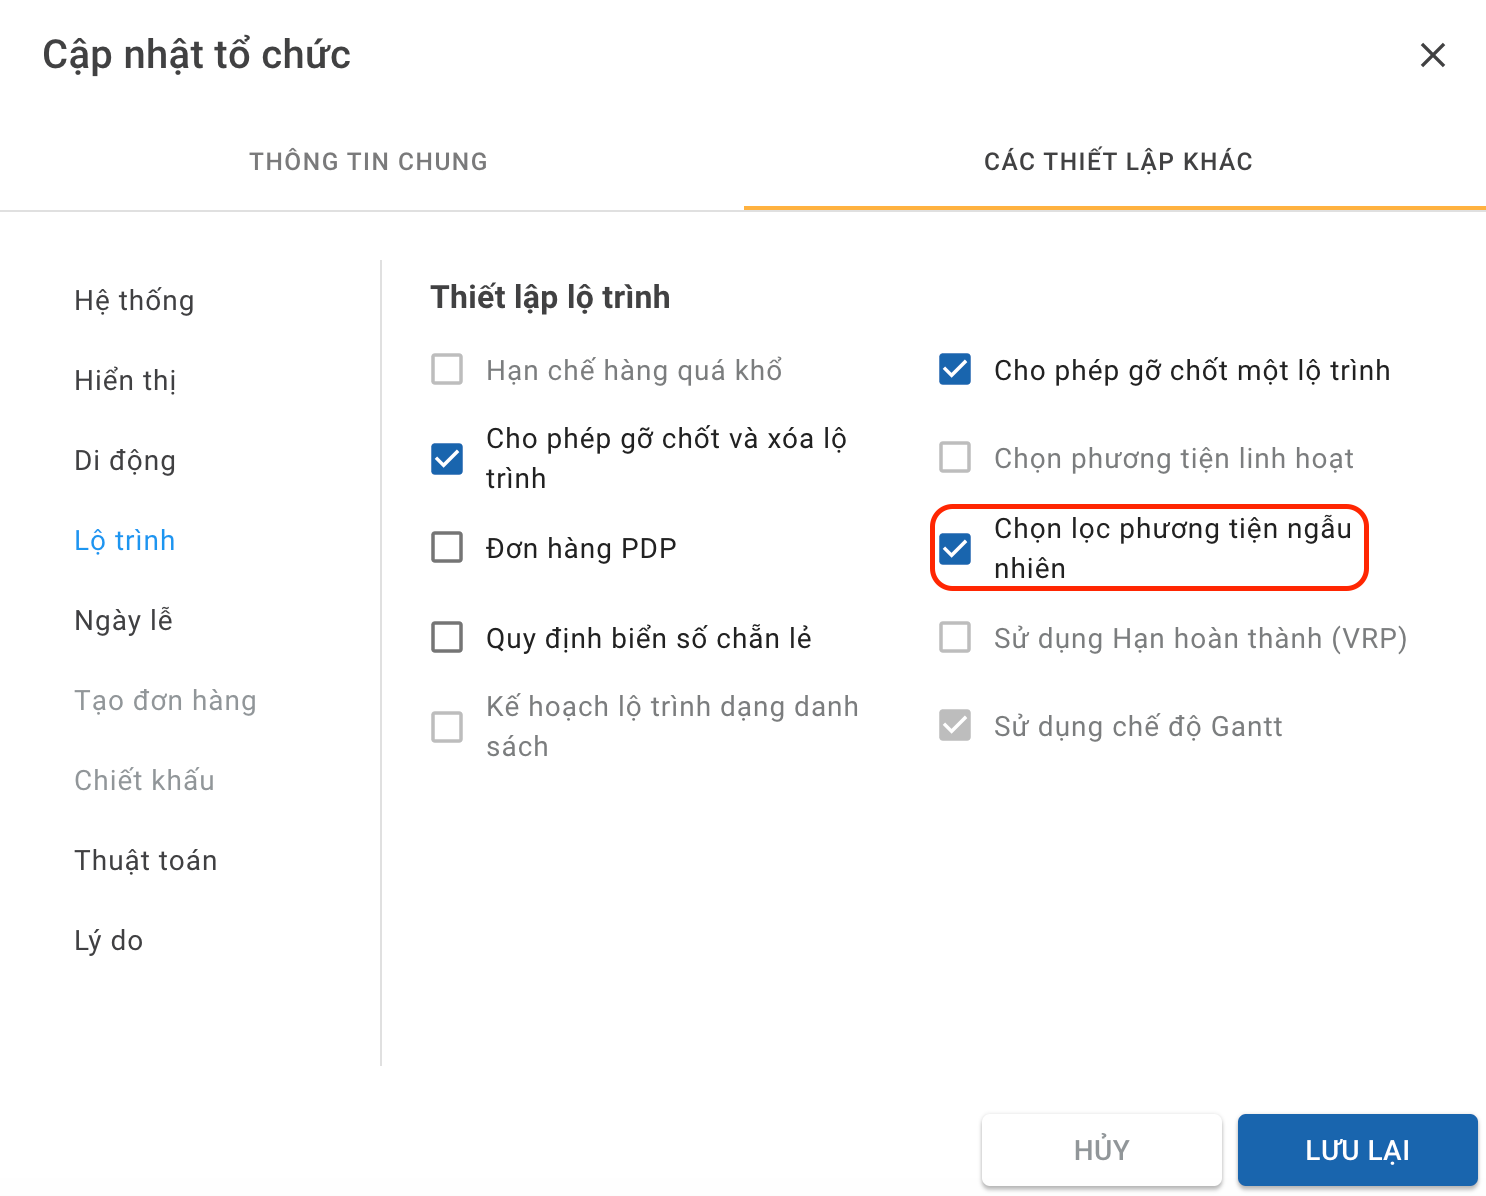
Illustration (Vietnamese)
Set up Customer Group as Multi-associated and set up hard time windows
- After you have enabled the above configurations, navigate to the Partners > Customer Groups tab to set up the Customer Groups. To do this, follow the steps below:
- 1 - Click the Edit icon of the Customer Groups which you want to set up
- 2 - On the Group Information form, tick the Multi-associated checkbox
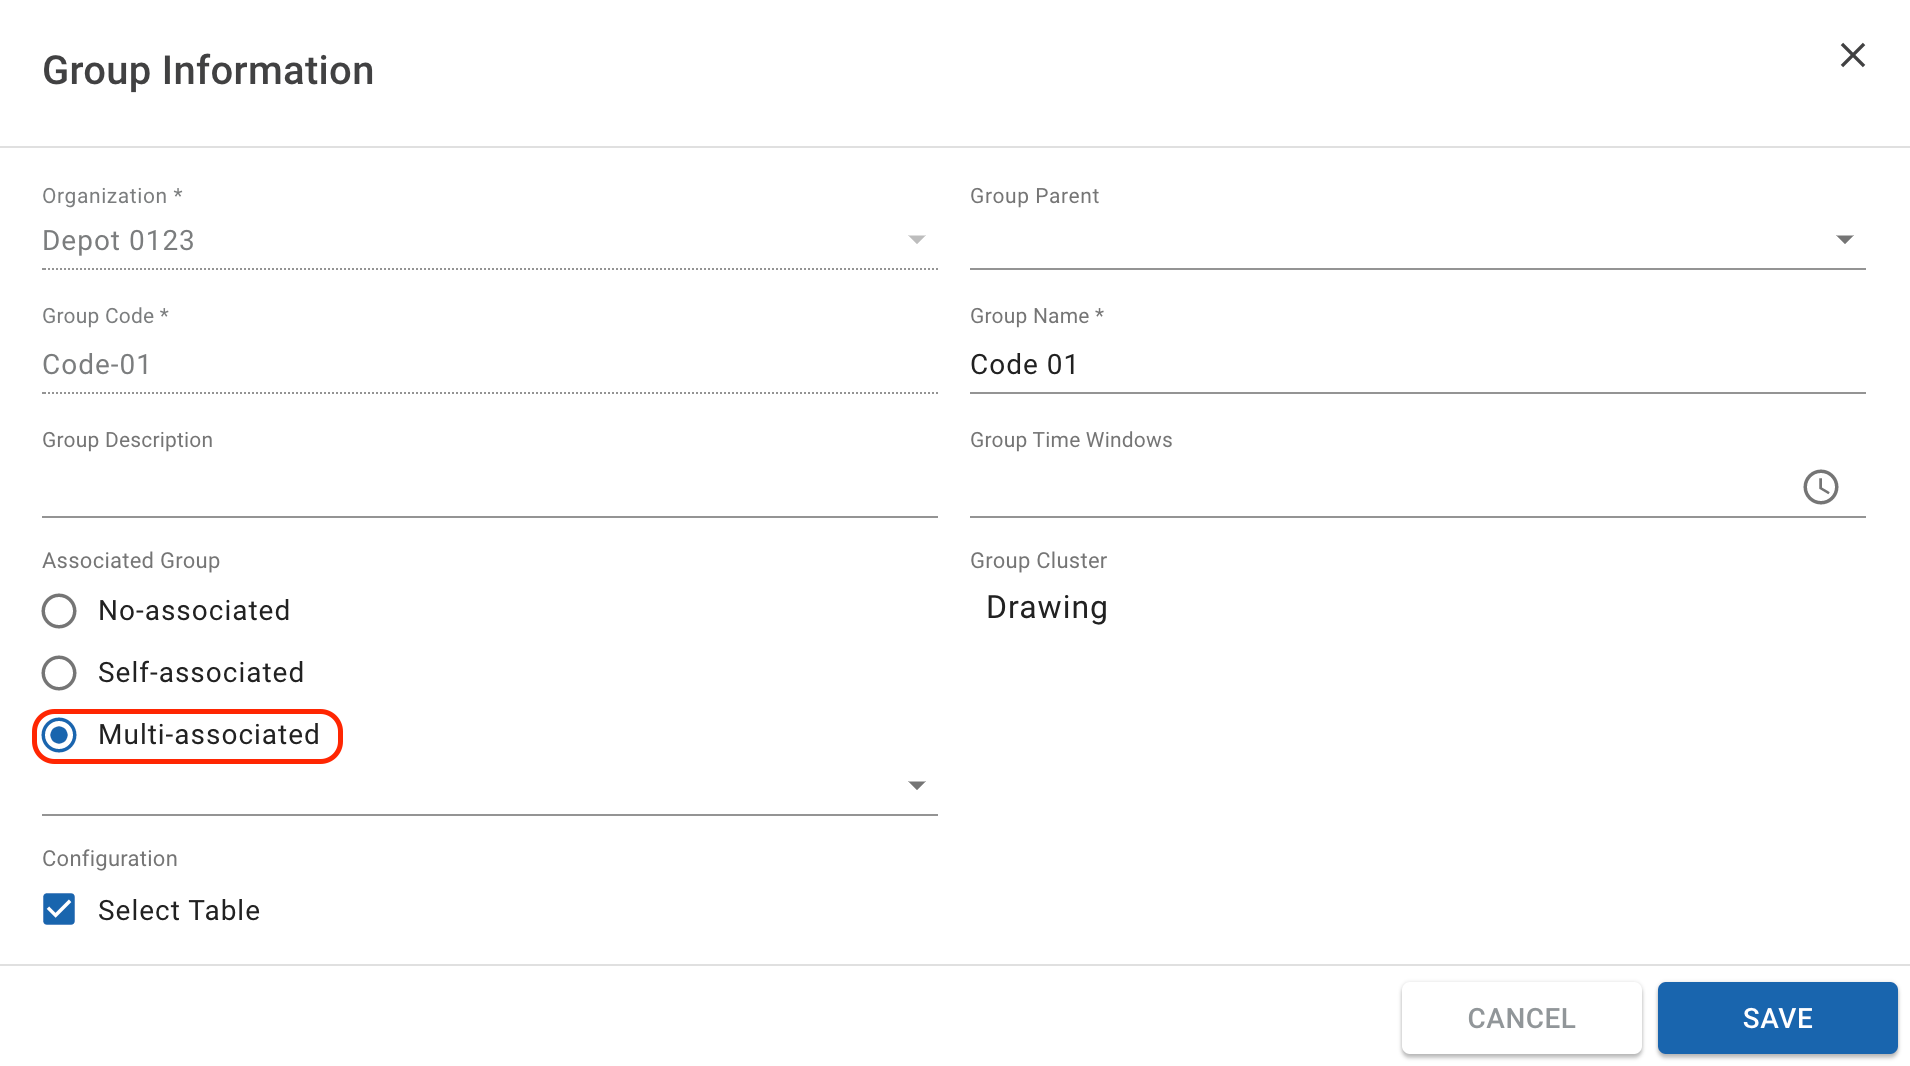
Illustration (English)
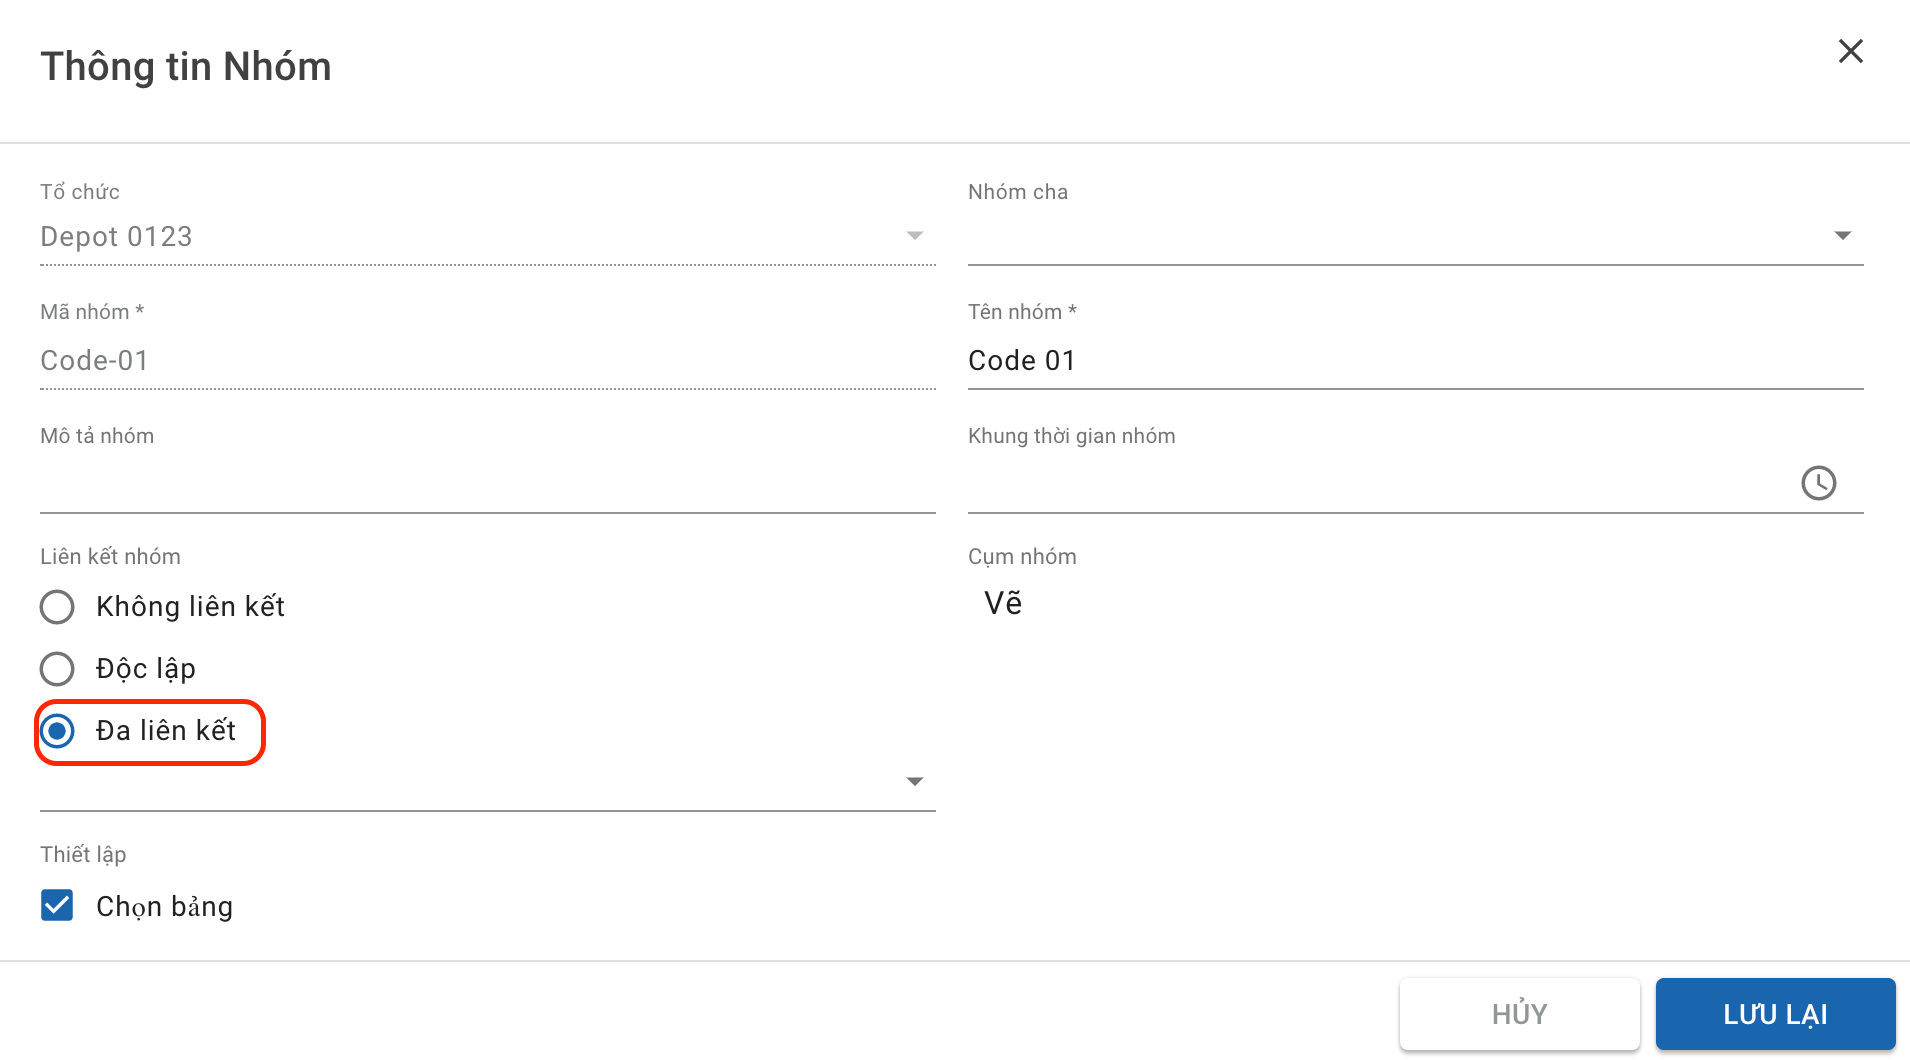
Illustration (Vietnamese)
- 3 - A field will appear right below the ticked Multi-associated checkbox. This field will specify the associated Customer Groups for the Customer Group being setup. Click on that field and tick the checkboxes of the Customer Groups that you want to associate with the Customer Group being setup. You can also input the Customer Group Code/Customer Group Name into the search bar to filter faster
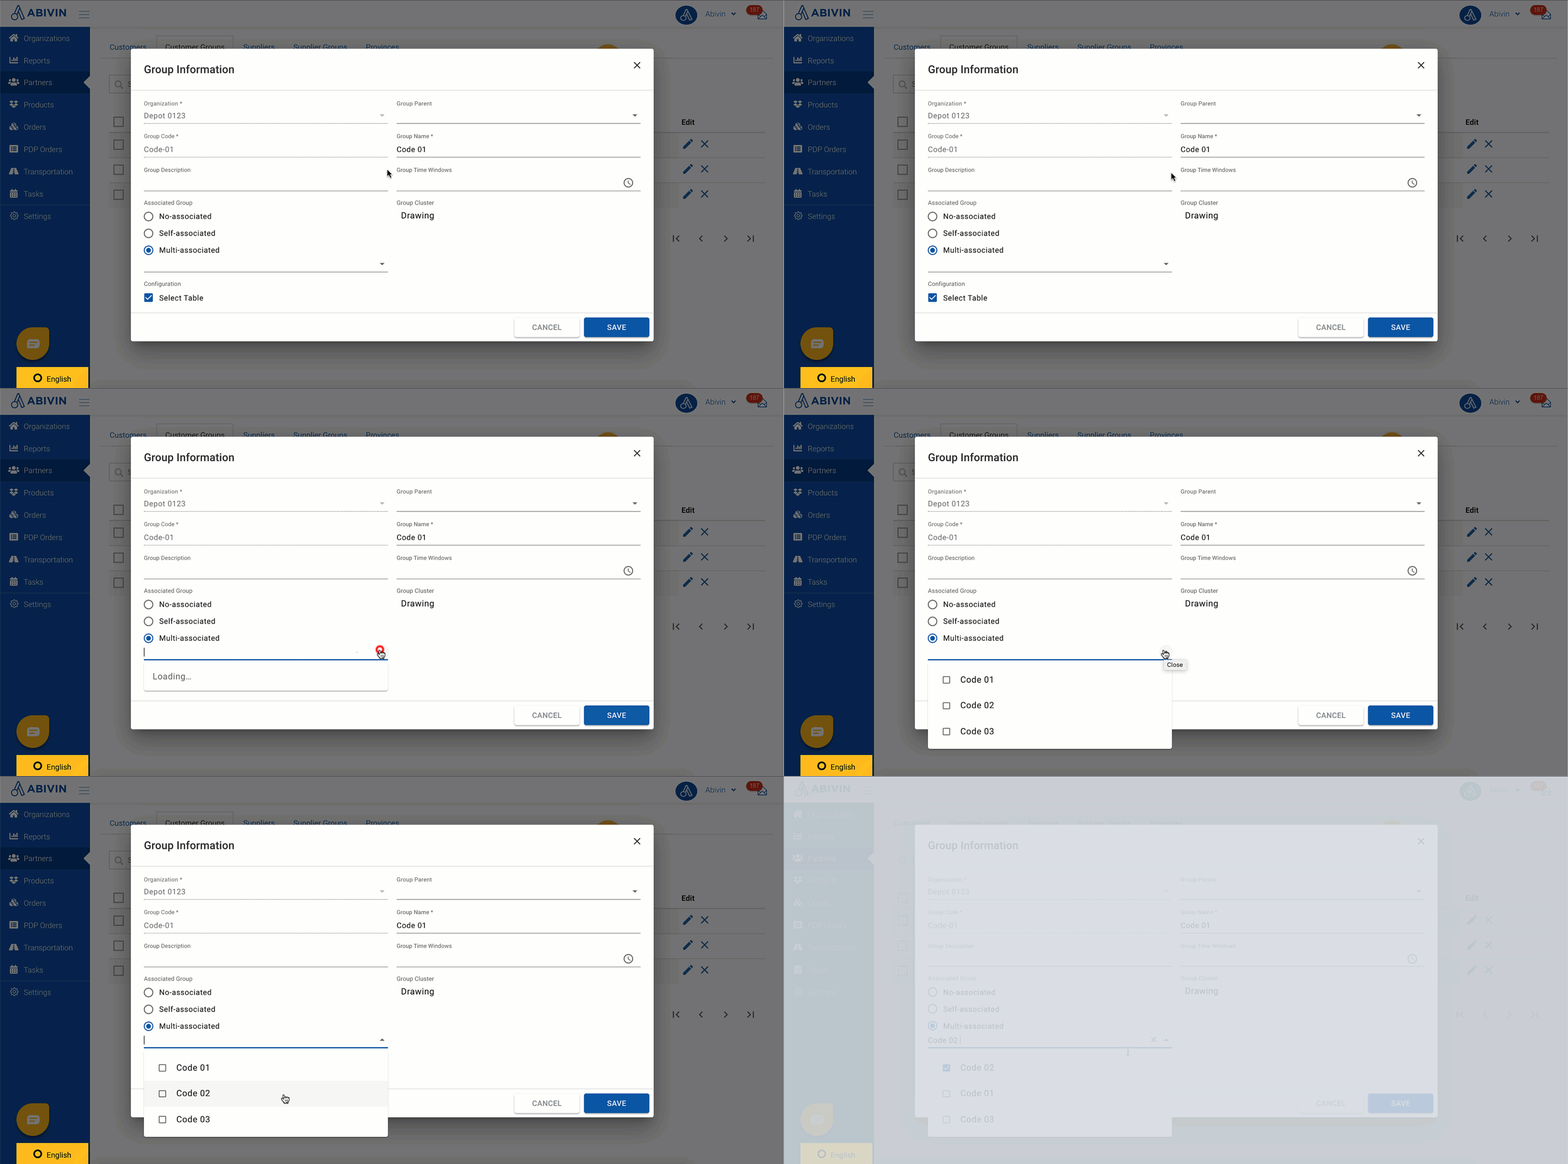
Illustration (English)
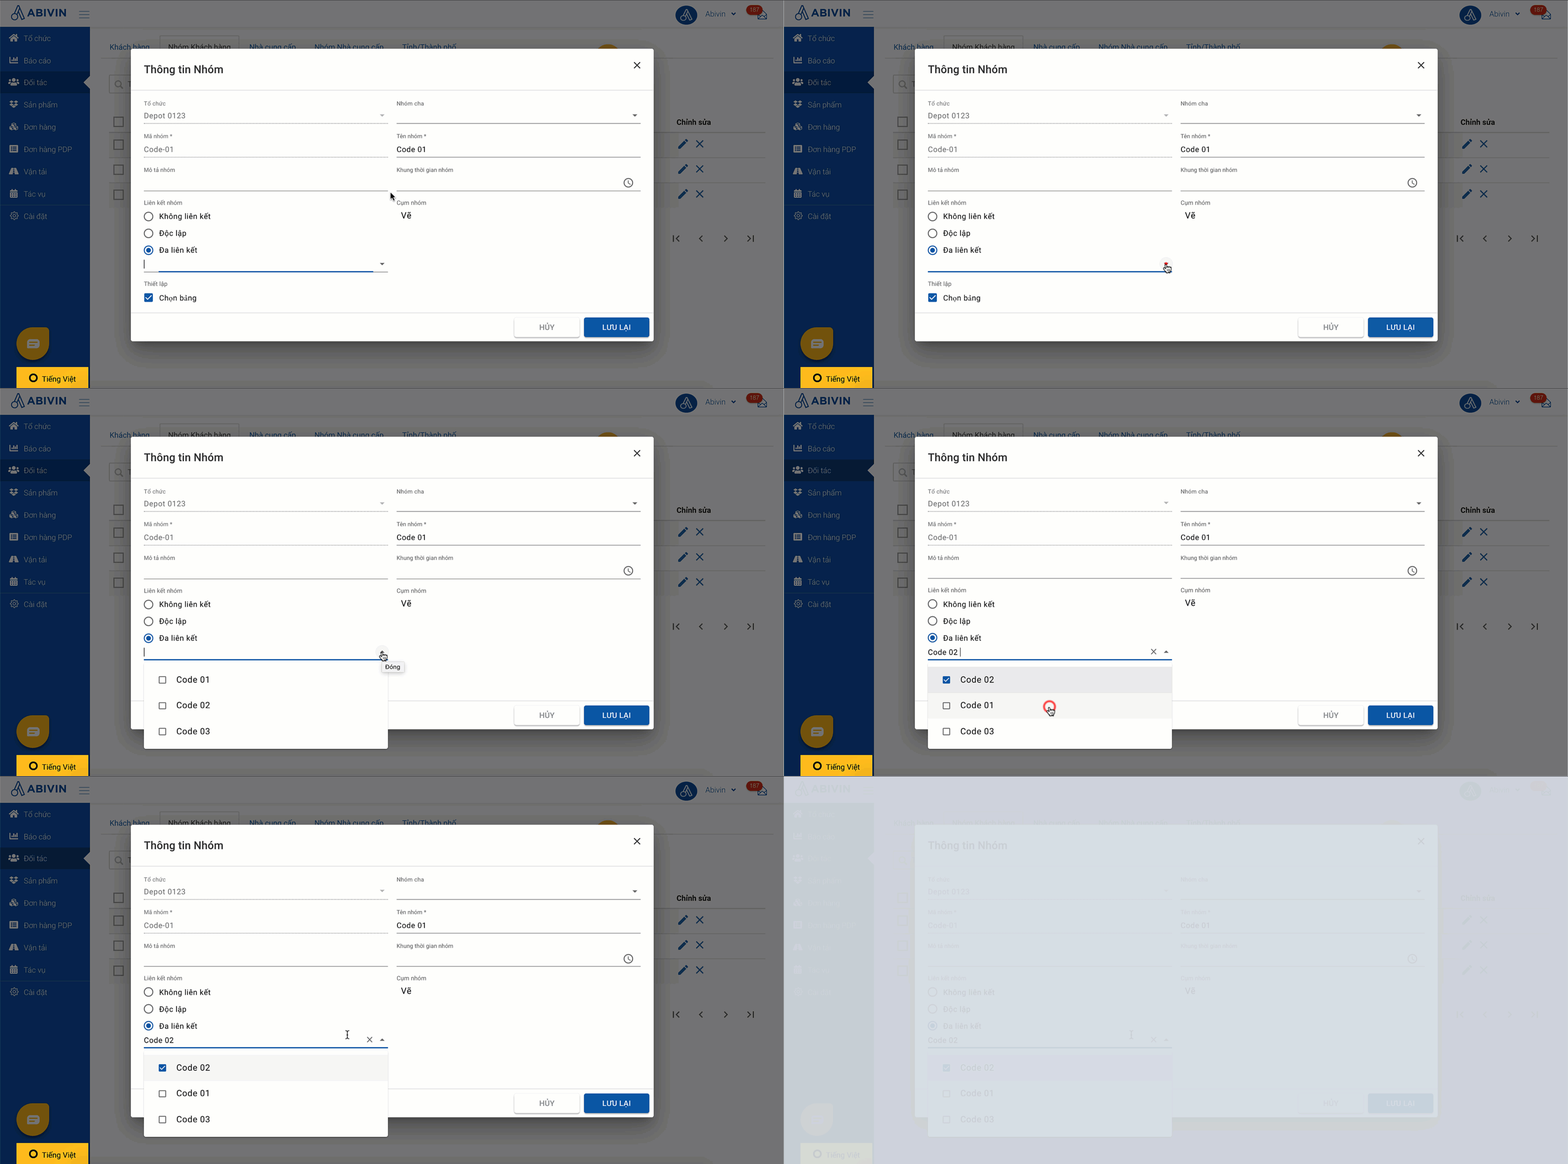
Illustration (Vietnamese)
- 4 - After selecting the associated Customer Groups, input the hard time window(s) of the Customer Group being set up in the Group Time Windows field
- The hard time window(s) of a Customer Group will serve two purposes:
- Purpose 1: Specify the time window(s) during which the vehicles can visit and deliver products for the Customers within that Customer Group
- Purpose 2: Determine the urgency level of the geographical clusters in the scenario there are multiple Customer Groups
- Note: The Customer Group hard time window must be in HH:mm-HH:mm (24 hour) format. If a Customer Group has multiple hard time windows, separate two adjacent hard time windows by a semicolon (;), for example, 08:00-16:00;17:00-21:00
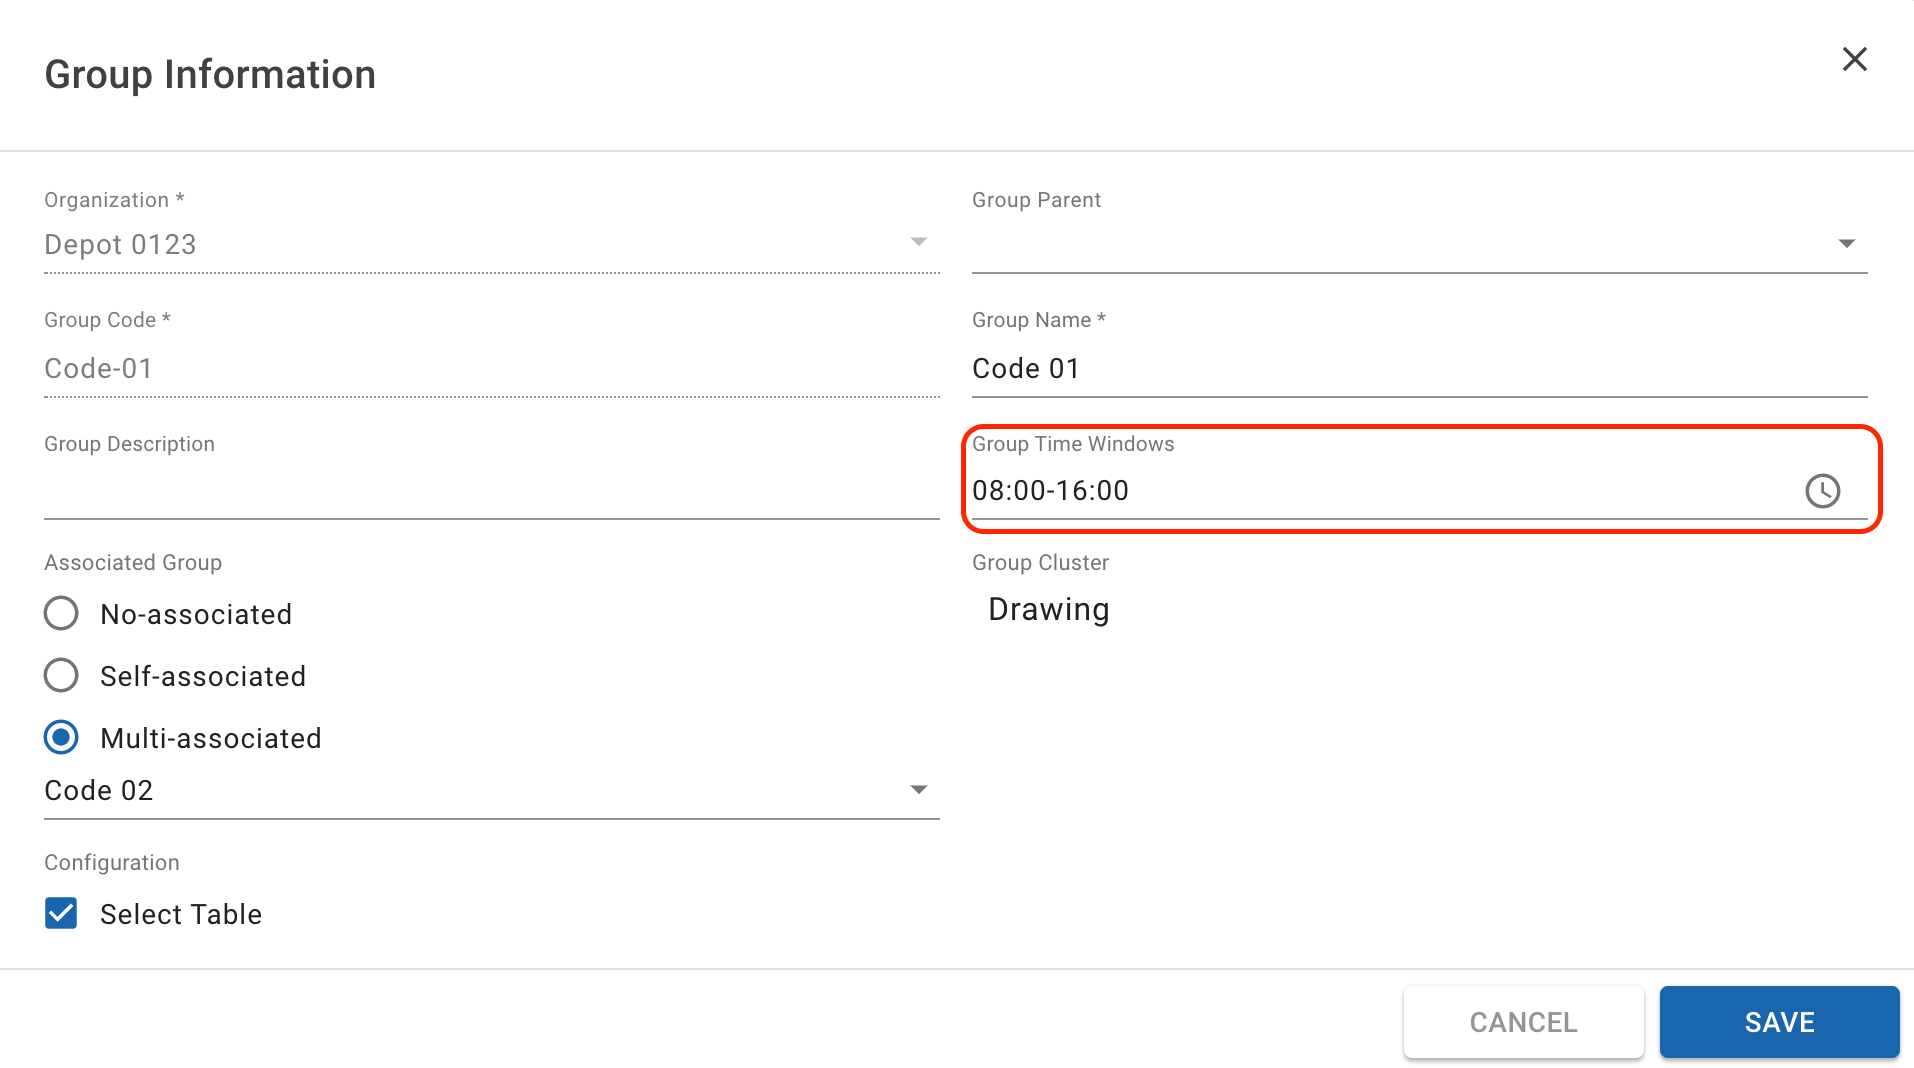
Illustration (English)
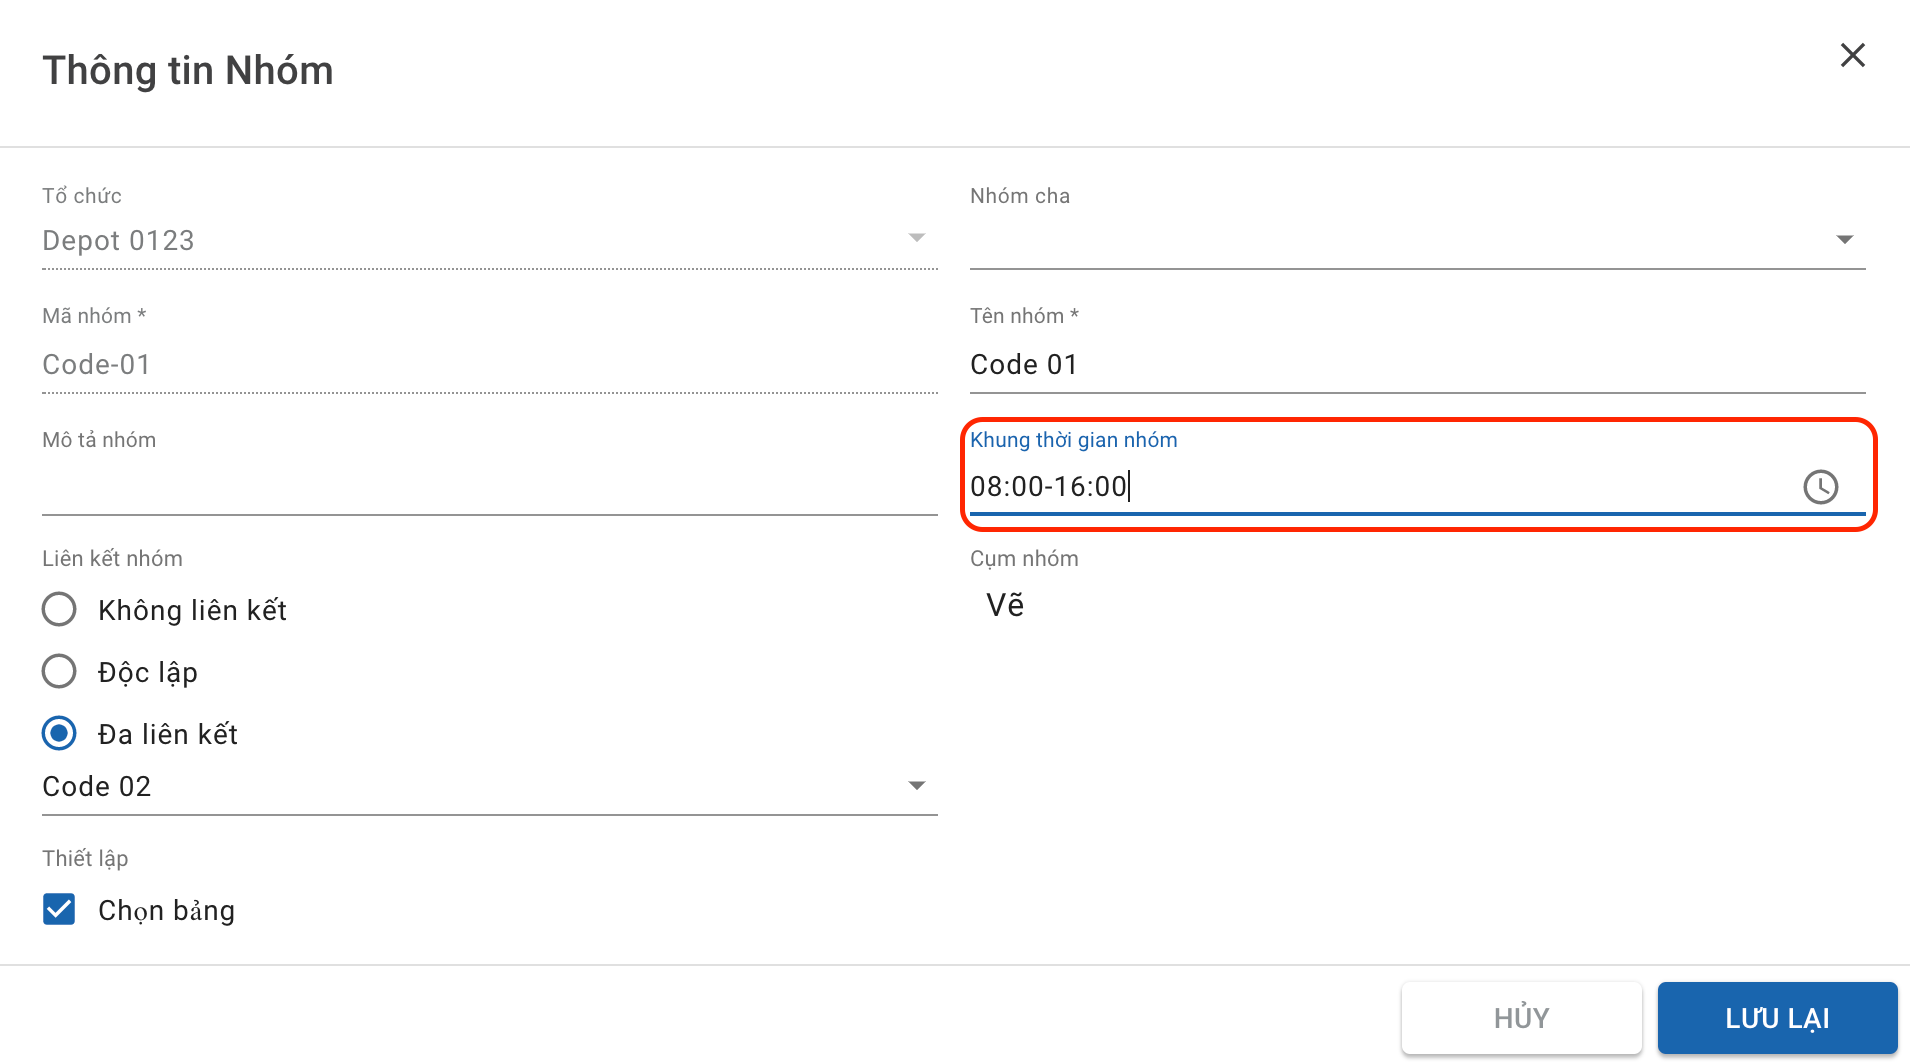
Illustration (Vietnamese)
Allocate Customers into Customer Groups
- After you have created the Customer Groups, you can proceed to create the Customers and allocate them into the proper Customer Groups
- During the Customer creation process (For both the Webform and the Excel import file), the system will automatically allocate the Customers into the appropriate Customer Groups by comparing the Customers' coordinate information (Latitude; Longitude) against that of the Customer Group's Main geographical cluster (Not any of its Sub geographical clusters). If the system detects that a Customer's coordinates fall within the coordinates of a Customer Group's Main geographical cluster, it will automatically allocate that Customer into that Customer Group
- There are a few things that we would like to note here:
- 1 - If there are Customers which have been created earlier than the Customer Groups and geographical clusters, then the system will not automatically allocate those Customers into the Customer Groups. Here you will need to either: 1. manually allocate each Customer into their appropriate Customer Group on the Web app, or 2. reimport the Customers using the Excel Customer import file in order for the system to initiate the automatic Customer Group allocation feature
- 2 - If a Customer locates on the borderline of two Customer Groups' Main geographical clusters, the system will allocate that Customer into whichever Customer Group that was created earlier than the other
Manage User-drawn Geographical Clusters
- After you have set up the Customer Groups, you can now proceed to create the custom geographical clusters for each Customer Group
- Within a particular Customer Group, users can draw two types of geographical clusters:
- 1 - Main geographical cluster: The geographical cluster that the system will process first during the Route Plan optimization process
- 2 - Sub geographical cluster: The geographical cluster that the system will process after the Main geographical clusters during the Route Plan optimization process
Access Customer Group Map View Mode
- 1 - Navigate to Partners > Customer Groups tab
- 2 - Click on the Organizations box above the Customer Group table. Select the Organization of Depot type
- 3 - After you have selected the Depot, the View Map icon will appear to the Organization box's right-hand side. By clicking on that icon, you will be directed to the map view mode. On this view mode, you can draw the geographic clusters for the Customer Groups as you wish
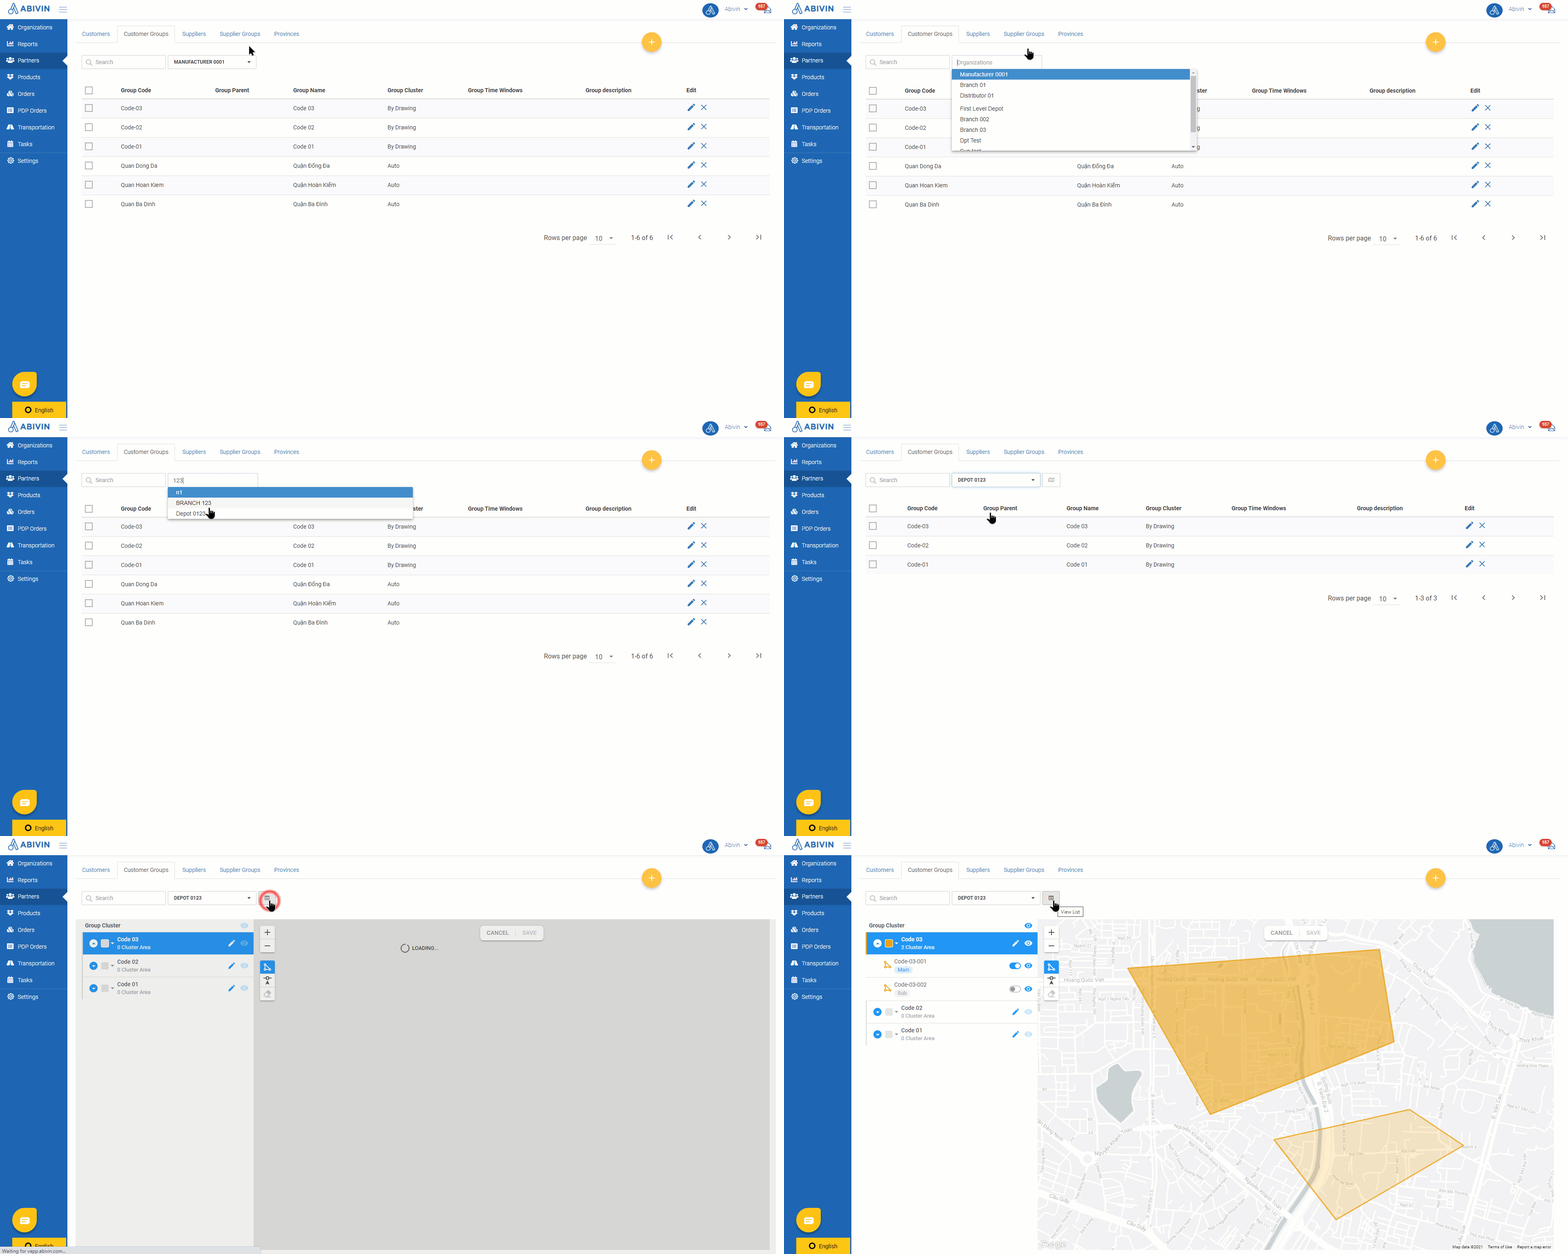
Illustration (English)
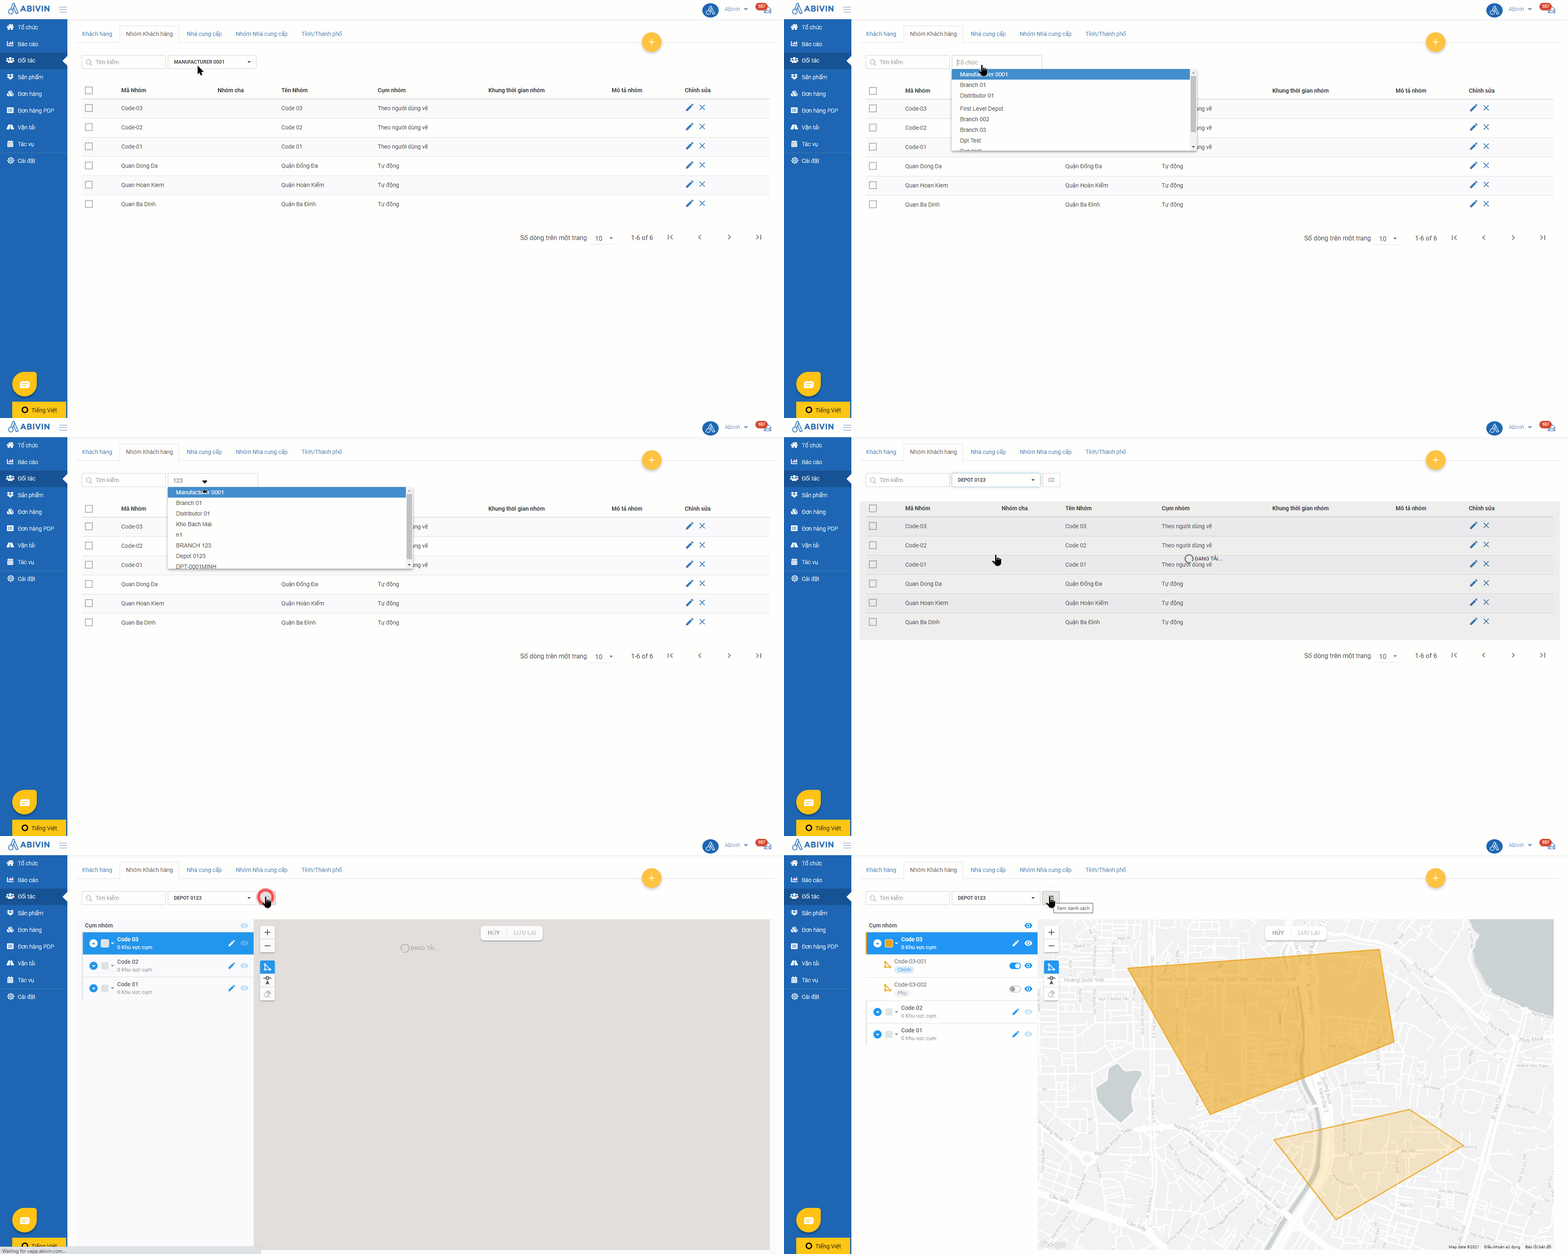
Illustration (Vietnamese)
- On this view mode, the panel on the left side lists the Customer Groups of the selected Depot as well as the user-drawn geographic clusters. The map area on the right side will display the Customer Groups' geographic clusters drawn by you
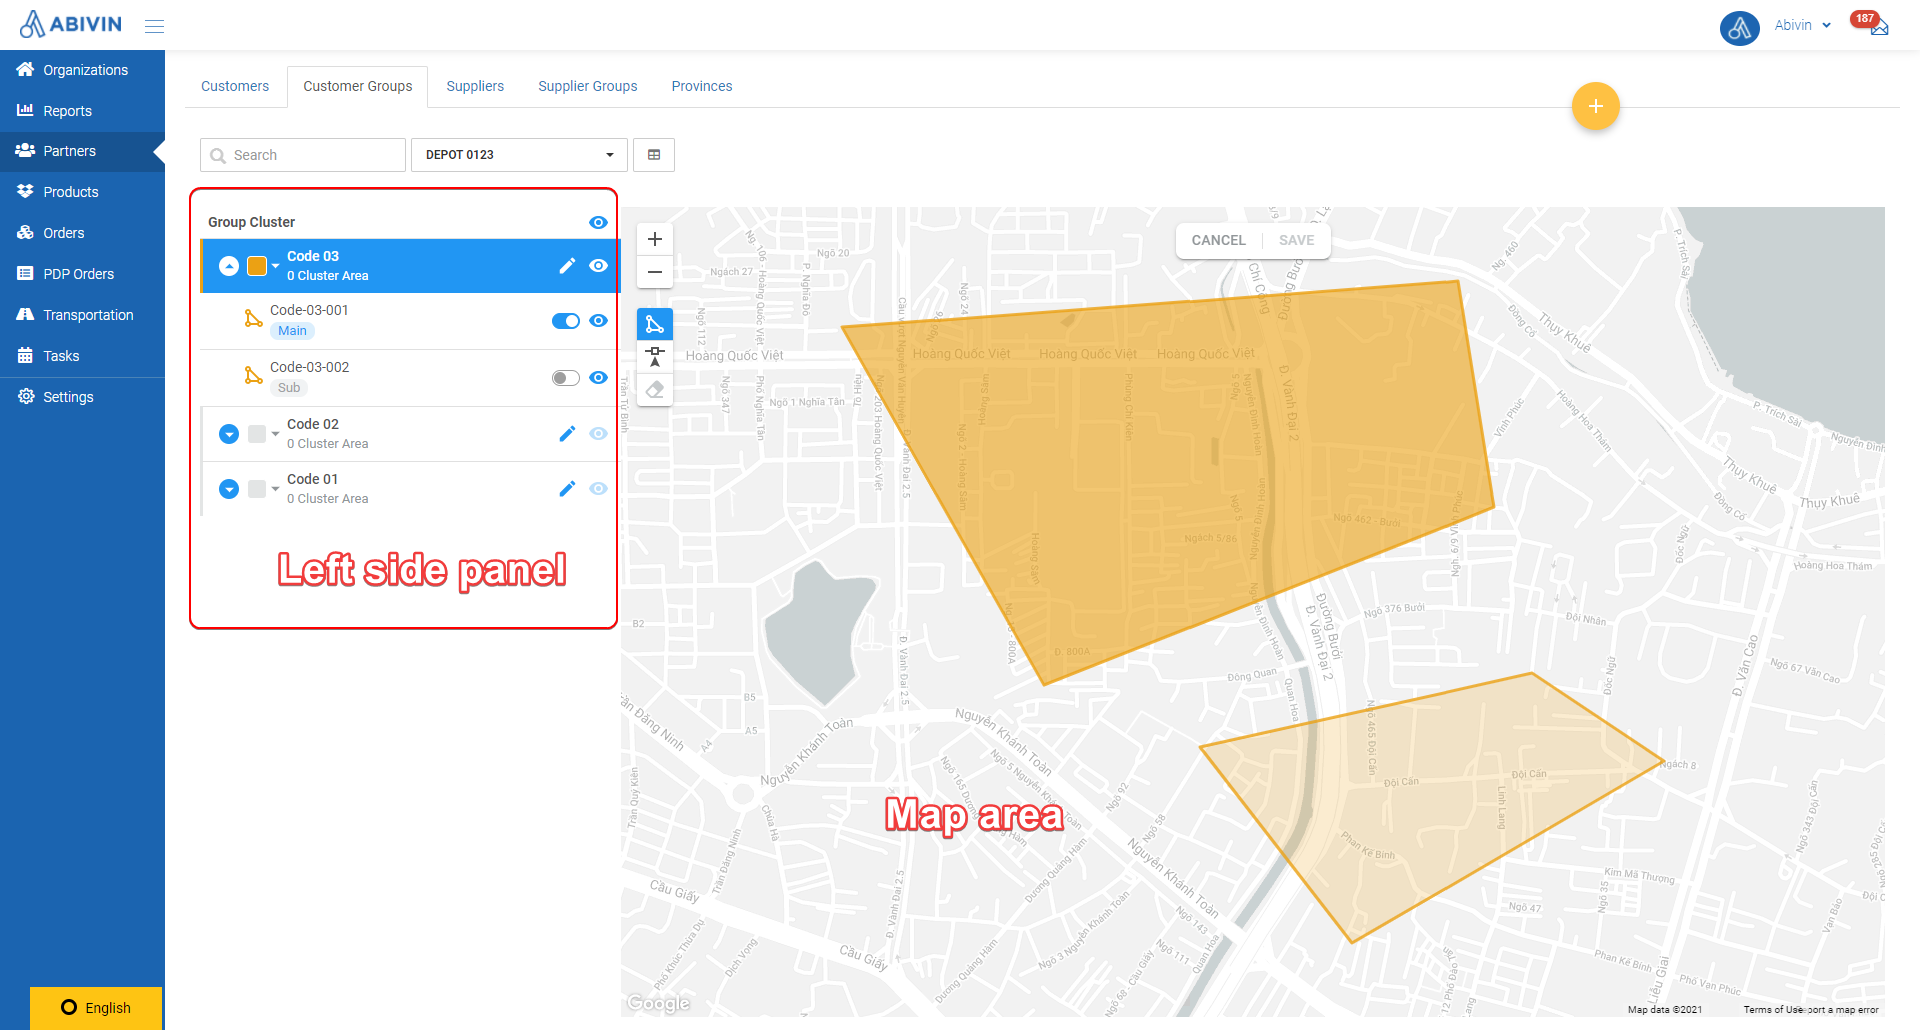
Illustration (English)
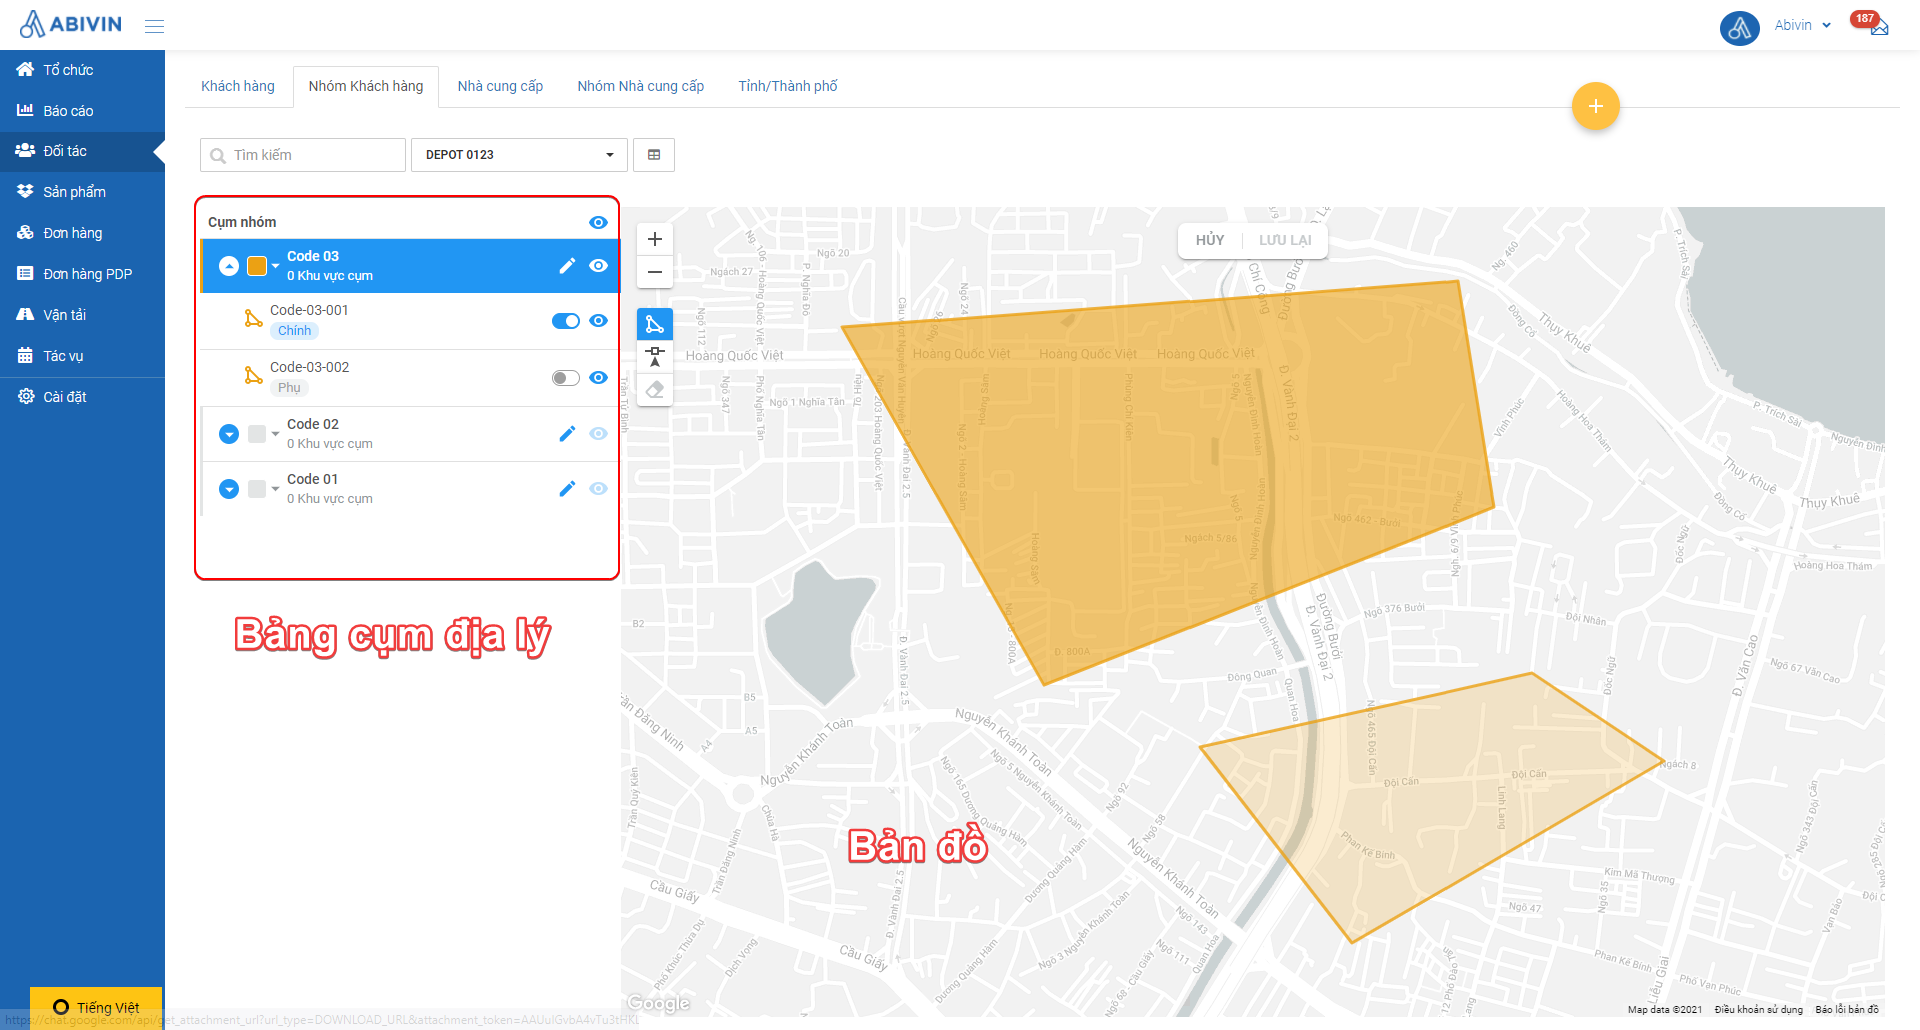
Illustration (Vietnamese)
Draw Geographical Cluster
- To draw a new geographical cluster, follow the steps below
- 1 - On the left side panel, click on the Customer Group for which you want to draw the geographical clusters
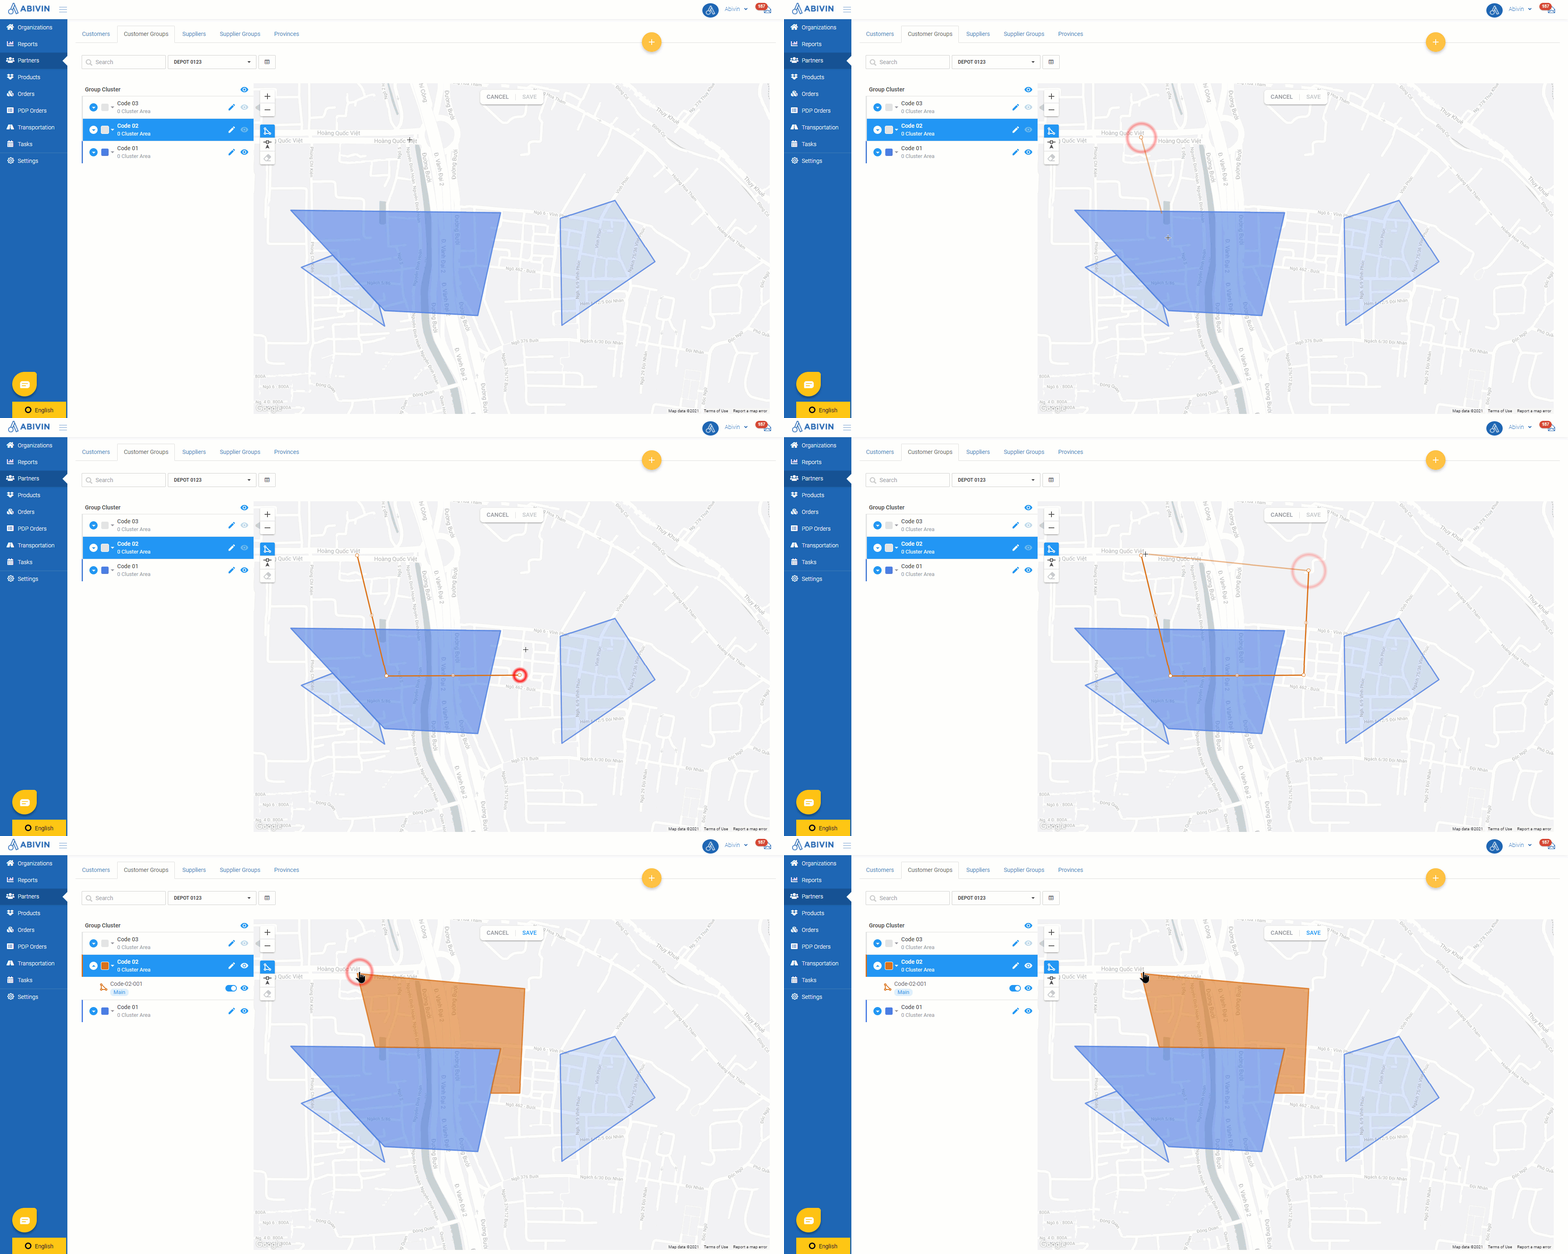
2 - Move your mouse onto the map area. Click the Zoom in or Zoom out buttons on the top left corner of the map to zoom in/out the map. Alternatively, you can use the middle mouse scroll to zoom. To move around the map, left-click on the map, then, with the left mouse button still clicked, drag your mouse pointer to the desired location. - 3 - Click the Create Cluster button right below the zoom in/zoom out buttons. Drag your mouse pointer to the point on the map where you want to mark the geographic cluster's starting point, then left-click that point. As you click, a white circle, called an anchor point, will appear on that point. Then, drag the mouse pointer to another point. Notice that a line will appear as you drag the mouse pointer. That line represents the borderline of the geographical cluster being drawn. Continue to click and drag to mark the anchor points of the geographical cluster
- 4 - To close the geographical cluster, left-click again on the first anchor point of that cluster.
- 5 - Click the Save button on the top middle of the map to finish creating the geographical cluster
- The geographical cluster is now created and will appear below its Customer Group on the left side panel
- This whole process is illustrated below
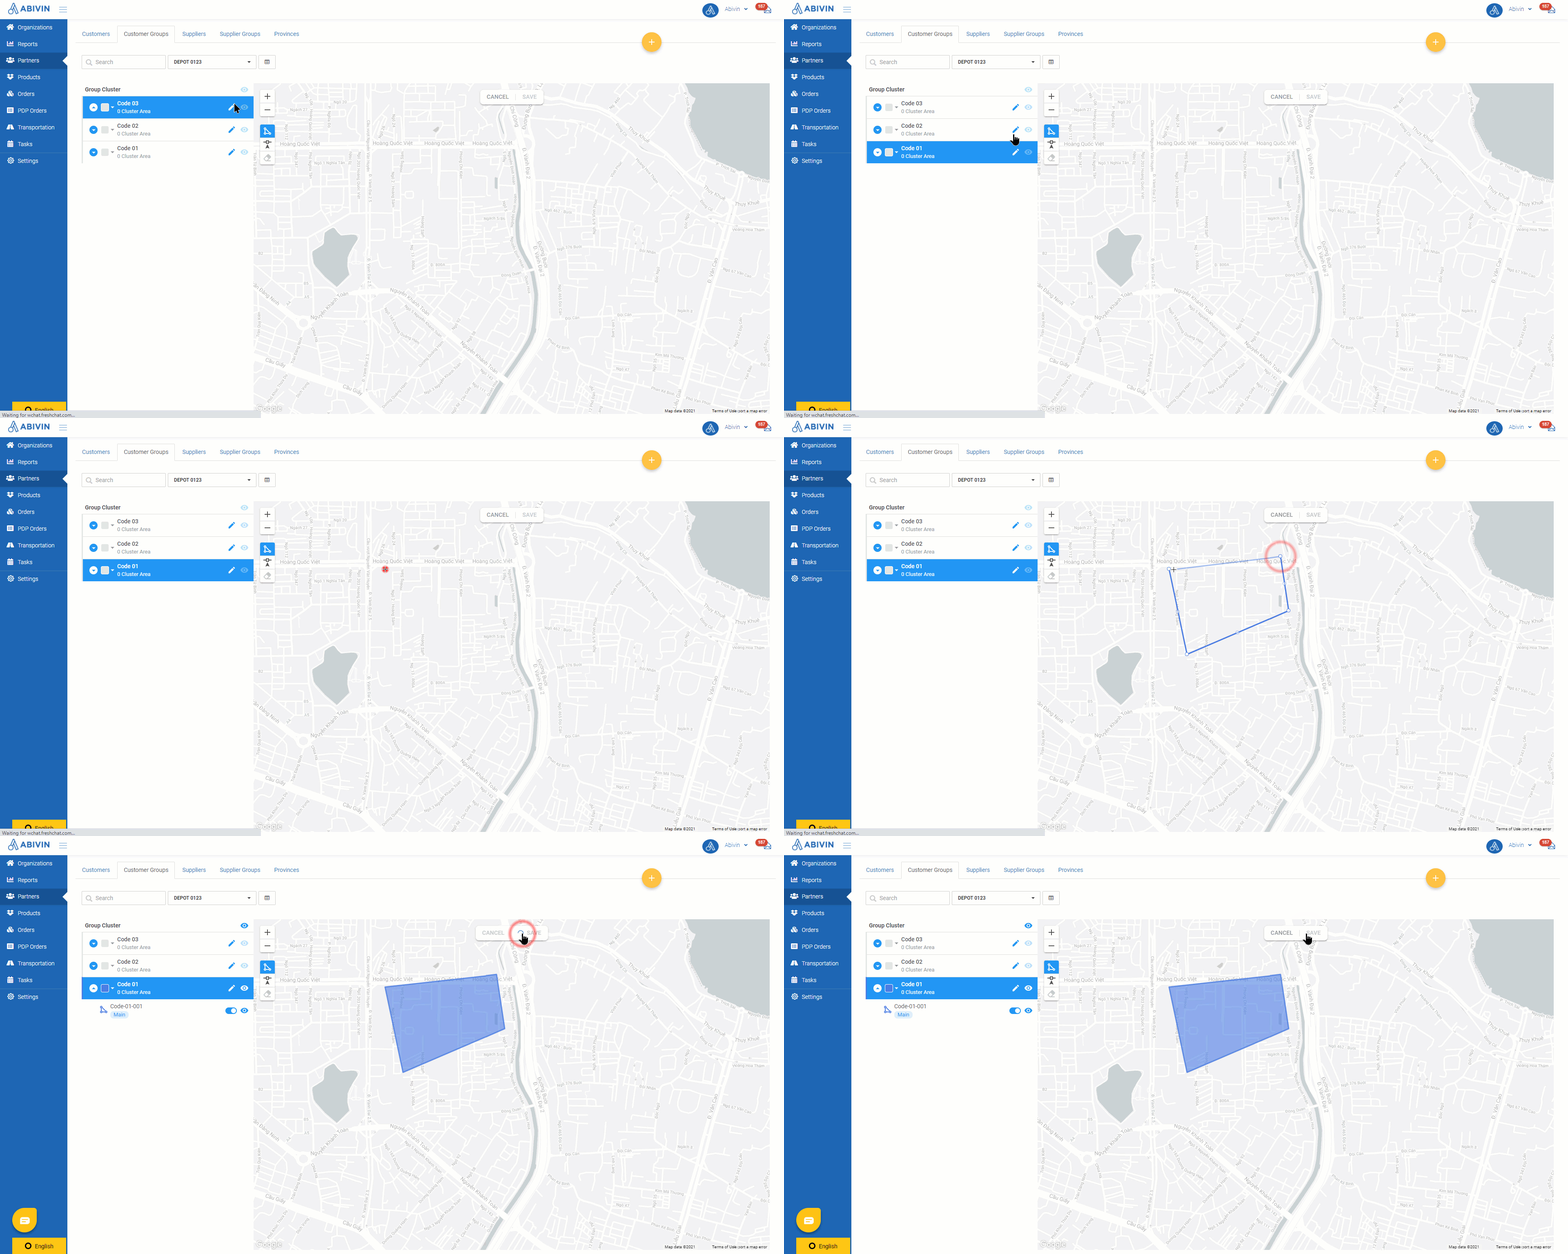
Illustration (English)
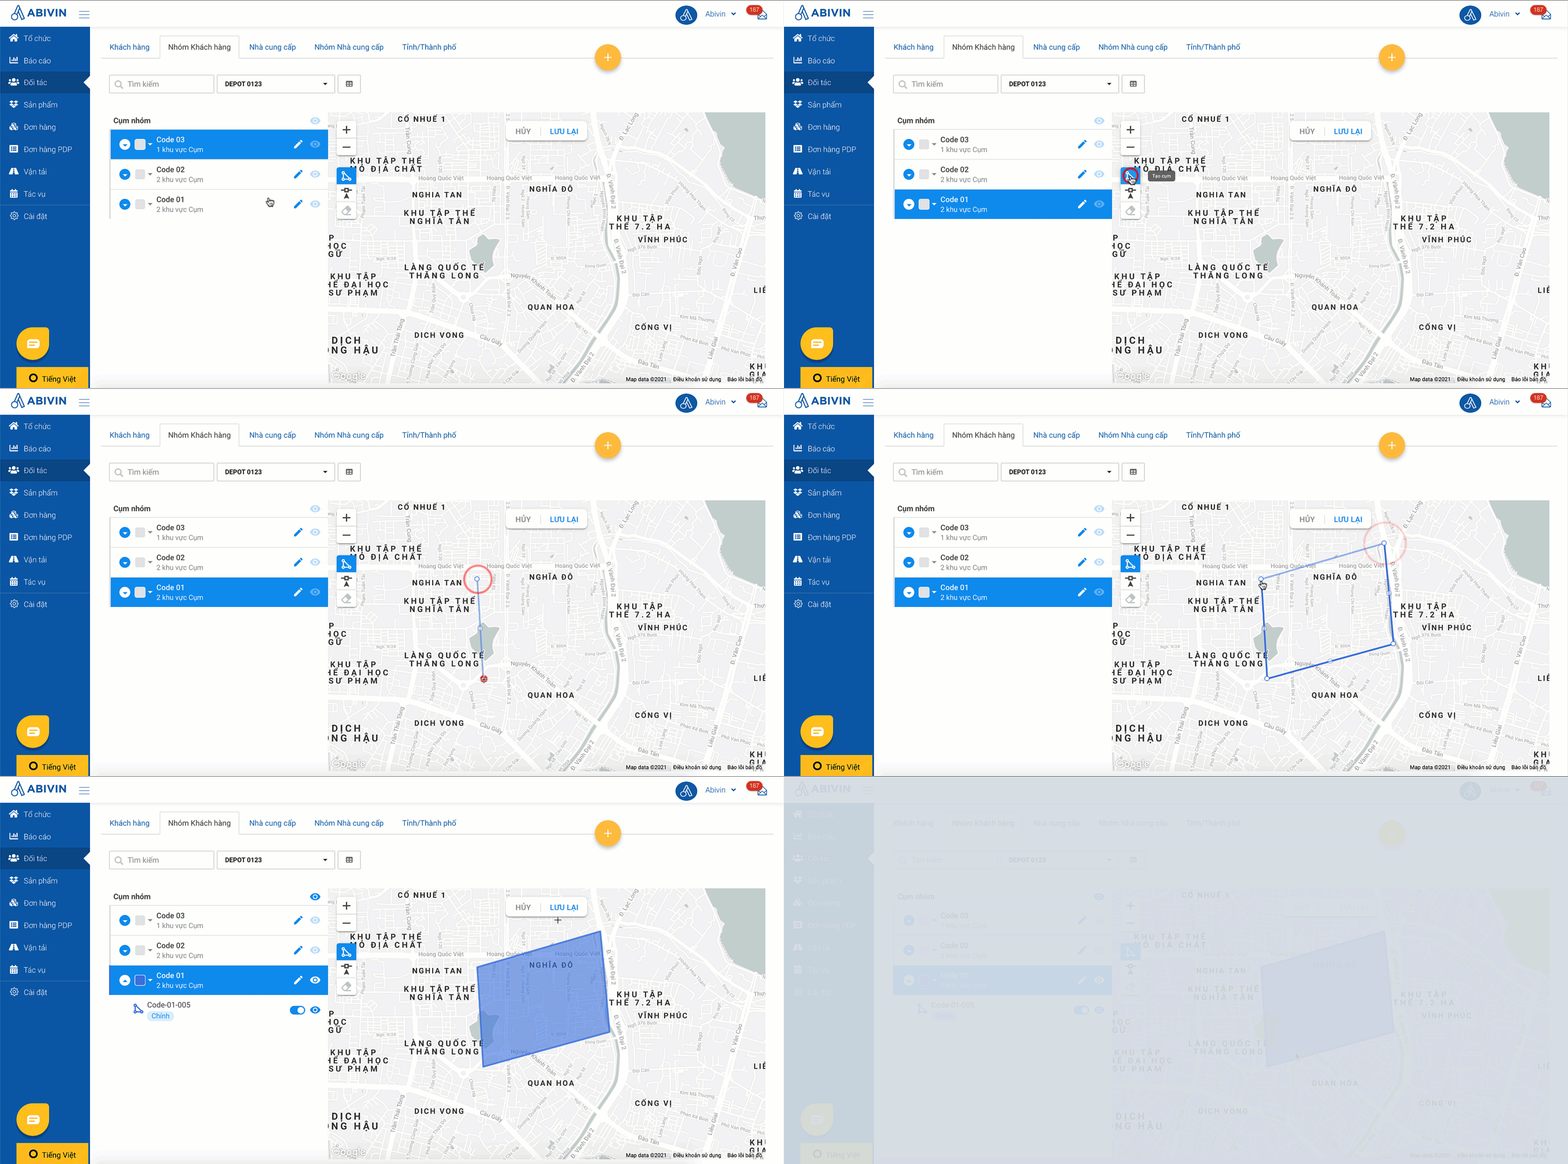
Illustration (Vietnamese)
- Repeat the steps above to create additional geographical clusters. Note that by default, the very first geographical cluster of a Customer Group will be that group's Main geographical cluster. Other geographical clusters that are created later of that same Customer Group will be the Sub geographical clusters. On the map, the main and sub geographical clusters of a Customer Group will have the same color, with the Main geographical cluster having lower transparency than the Sub geographical clusters
- Important Even though you can draw the sub geographical clusters not adjacent to the main geographical cluster, the system will apply the routing algorithms to the sub geographical clusters which are adjacent to their main geographical cluster during the Route Plan optimization process
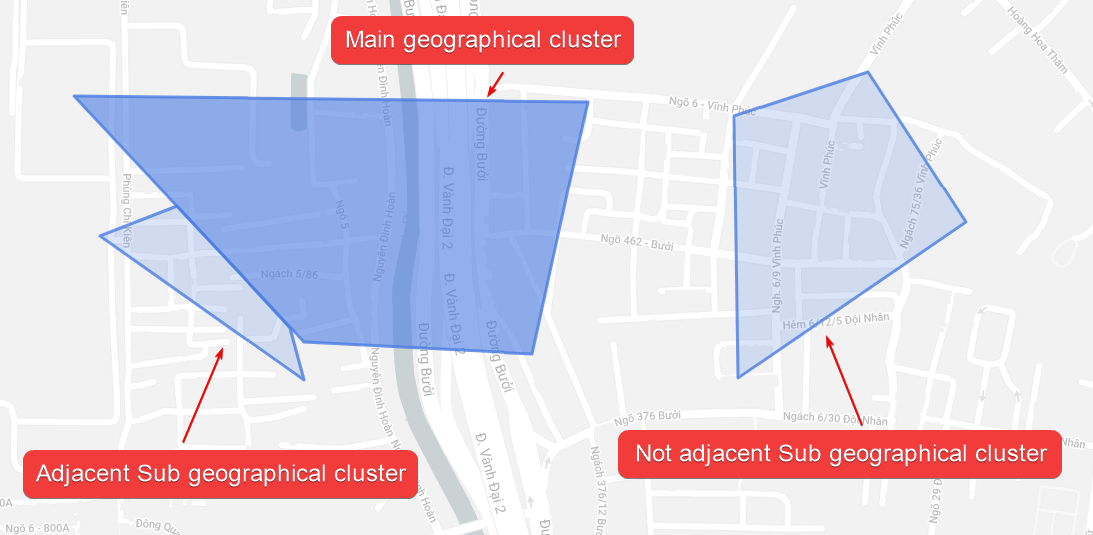
Illustration (English)
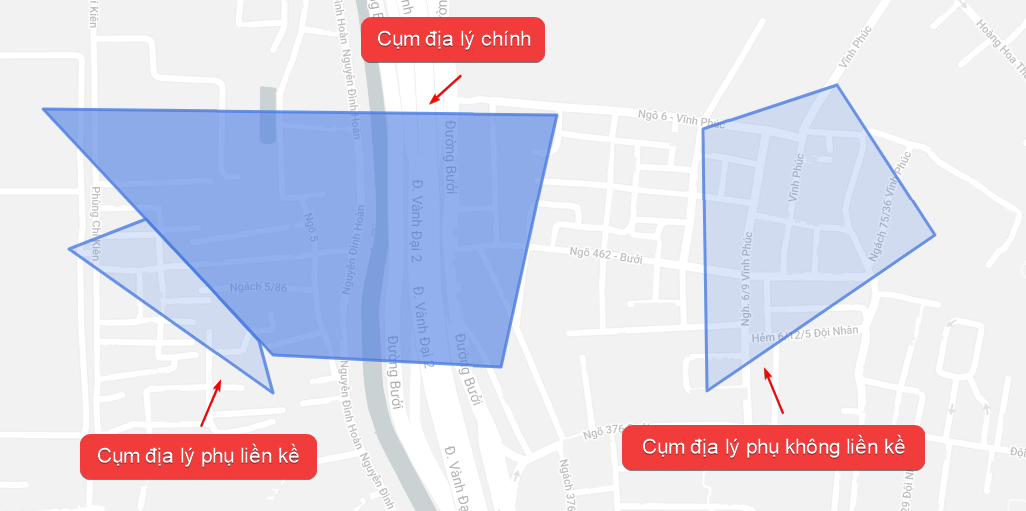
Illustration (Vietnamese)
Switch Geographical Cluster to Main/Sub Status
- To switch the main geographical cluster's status from Main to Sub, click the toggle button of that cluster on the left side panel. When the toggle button switches to , the main geographical cluster is now switched to sub geographical cluster
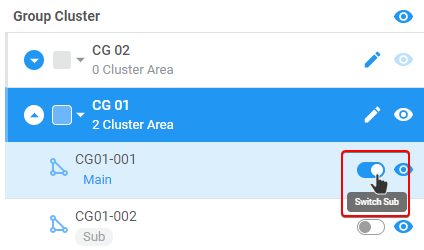
Illustration (English)
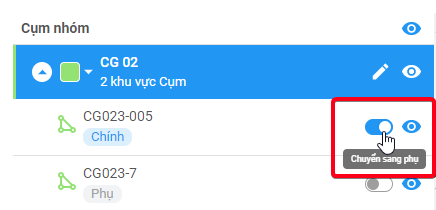
Illustration (Vietnamese)
- After a Customer Group's main geographical cluster has been switched to sub geographical cluster, you can switch a sub geographical cluster of that group to the Main status
- If a Customer Group already has a main geographical cluster, then when you switch a sub geographical cluster of the Customer Group to the Main status, the former main geographical cluster will become the sub geographical cluster
Main Geographical Cluster Overlapping
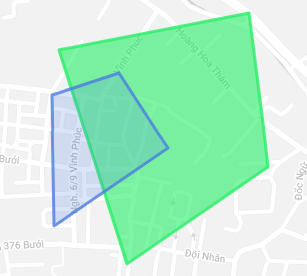
- When you draw a Customer Group's Main geographical cluster, if that Main geographical cluster overlaps another Customer Group's existing main geographical cluster, then as you finish drawing the cluster area, the overlapping area will be subtracted from the area of the main geographical cluster recently created
- This will also apply to the following scenarios:
- 1 - Draw a Customer Group's Sub geographical cluster that overlaps that same Customer Group's Main geographical cluster
- 2 - Draw a Customer Group's Sub geographical cluster that overlaps another Customer Group's existing Sub geographical cluster
- In other situations (Draw a Customer Group's Sub geographical cluster that overlaps another Customer Group's existing Main geographical cluster; draw a Customer Group's Main geographical cluster that overlaps another Customer Group's existing Sub geographical cluster), the geographical clusters can overlap without being subtracted
Cancel Drawing Geographical Cluster
- In the process of drawing a geographical cluster, you can cancel anytime by clicking on the Cancel button on the top middle of the map

Edit Geographical Cluster
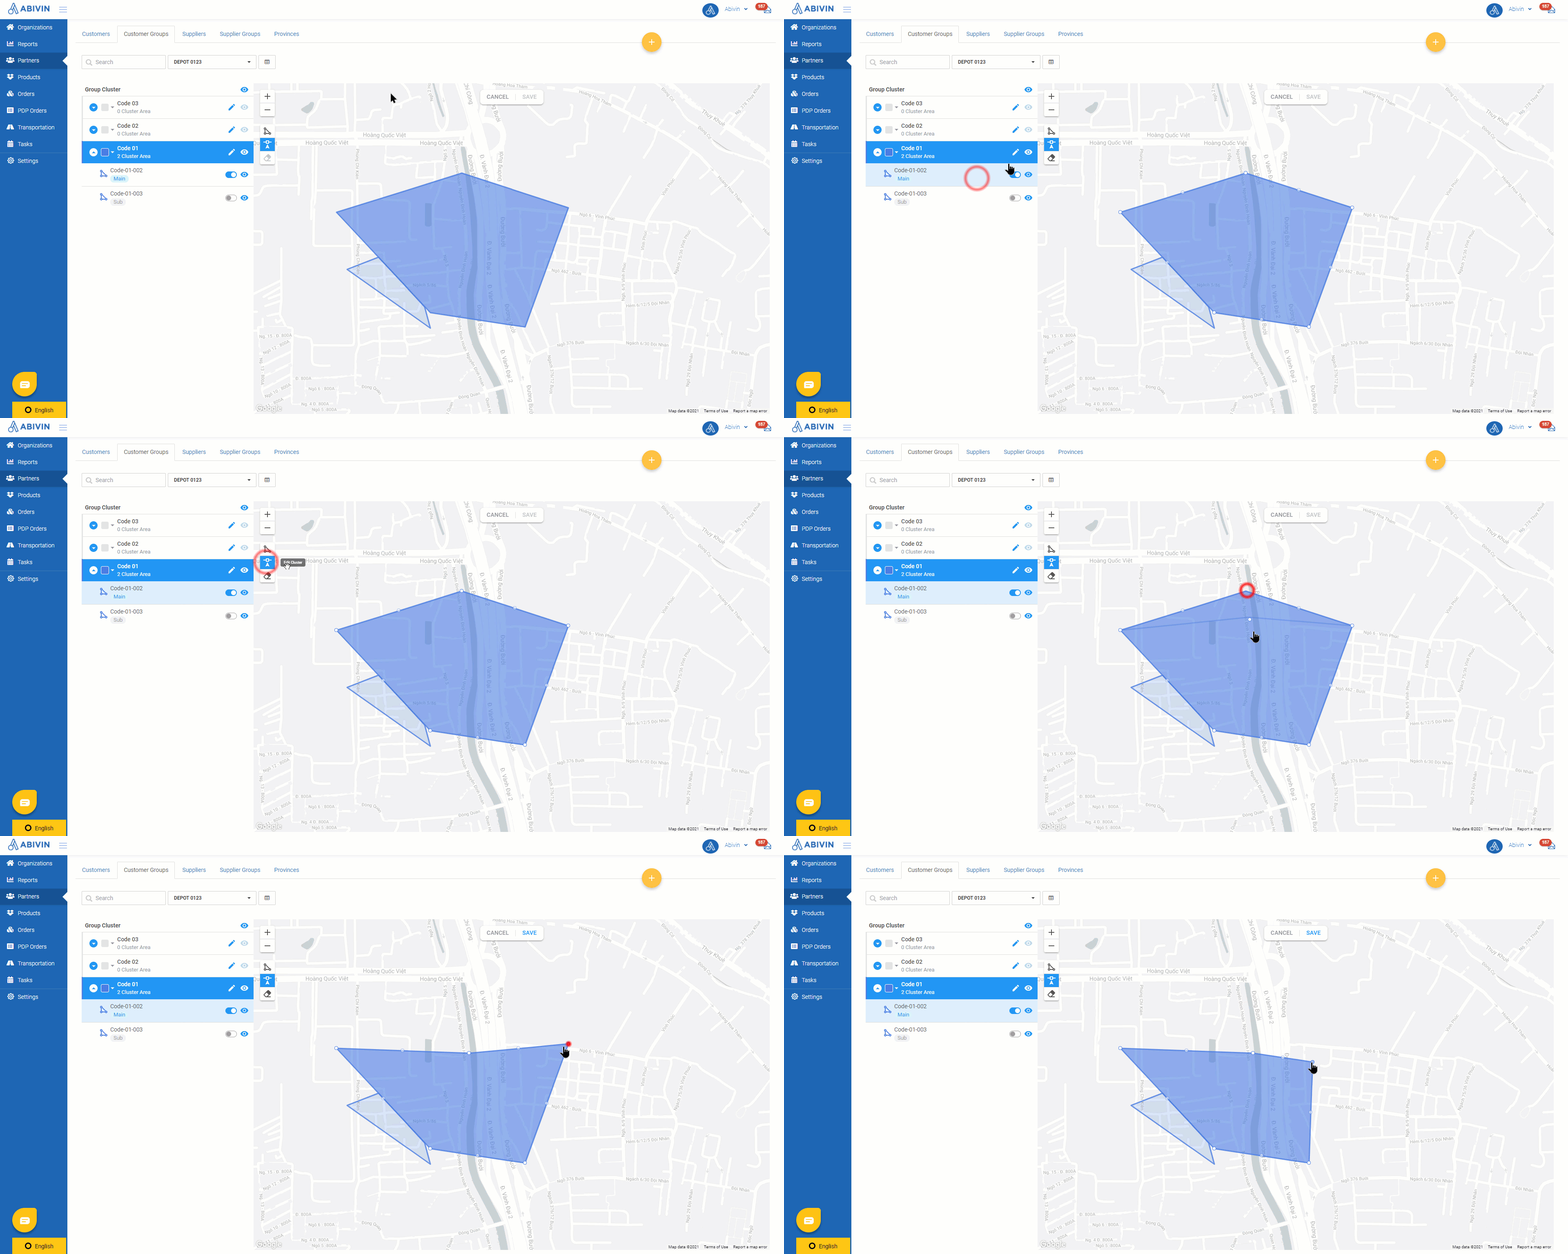
- To edit an existing geographic cluster, first, select that geographical cluster. As the geographical cluster is selected, its anchor points will appear. Left-click the anchor points and drag them to new points on the map. After you have made the changes, click the Save button to save the changes. You can also cancel the editing process at any time by clicking the Cancel button
Hide Geographical Cluster
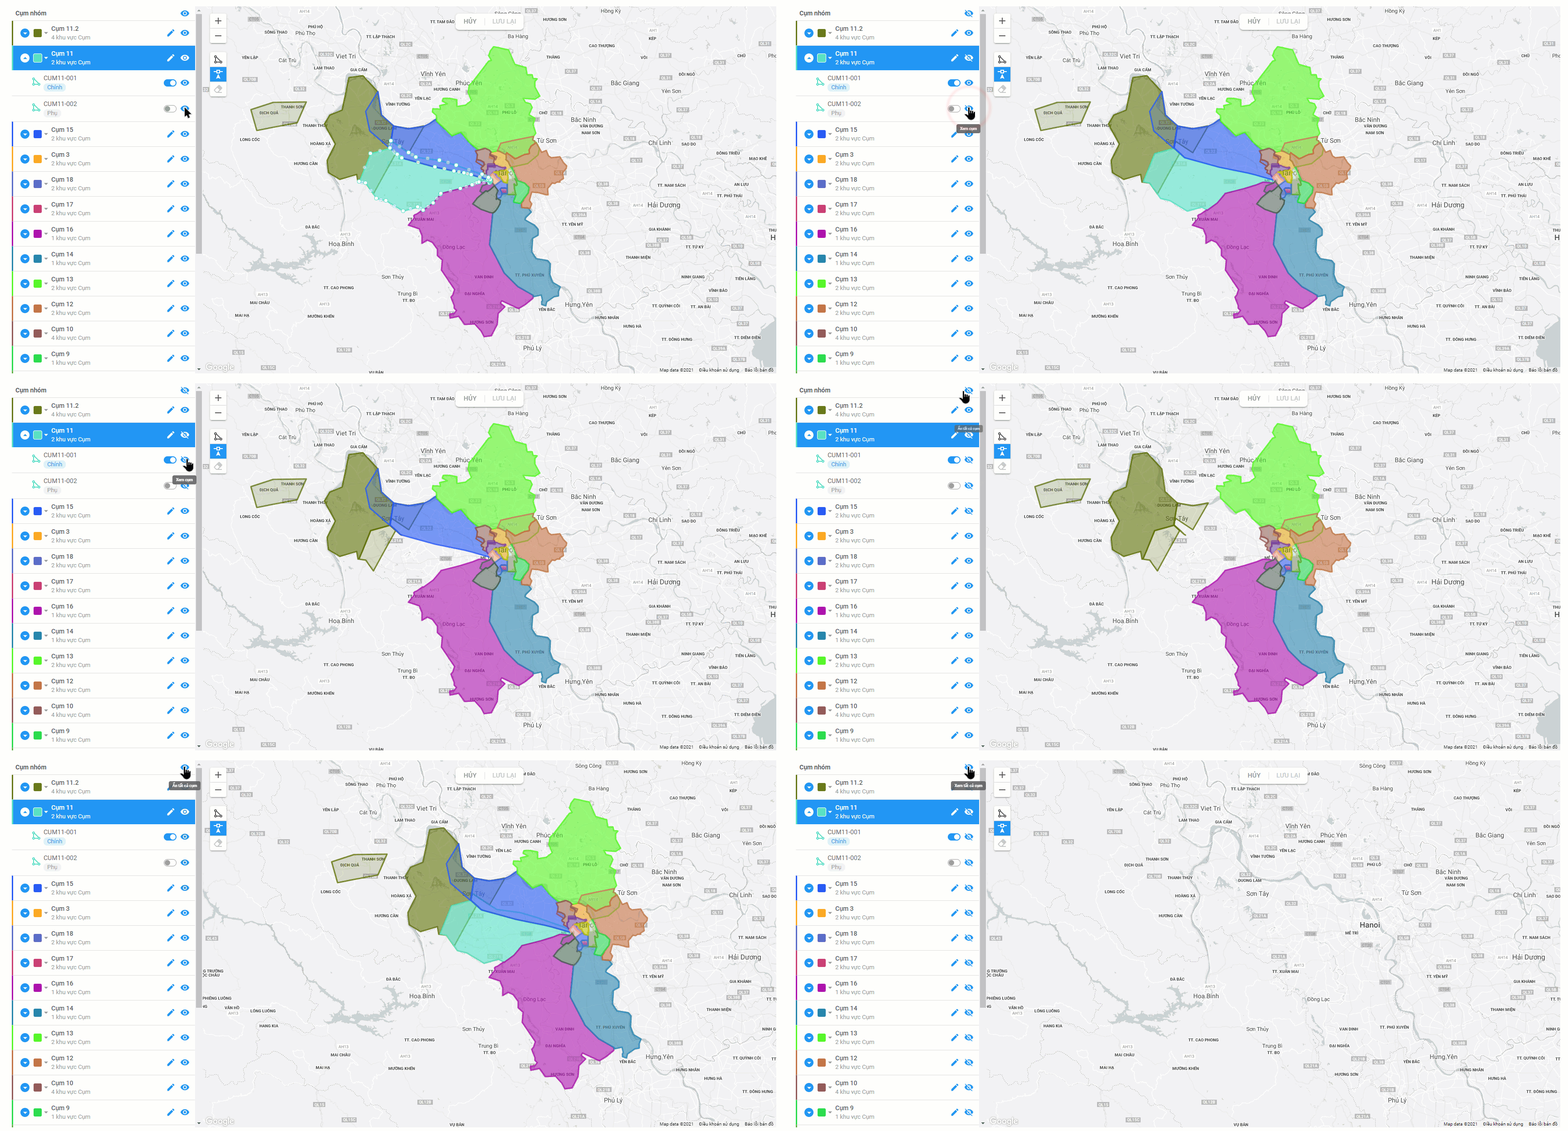
- To hide a geographical cluster, click its respective eye icon on the left side panel. When that icon switches to , the geographical cluster will be hidden on the map area. You can also hide all geographical clusters of a Customer Group by clicking the group eye icon. To hide all Customer Groups' geographic clusters, click the eye icon above all the Customer Groups on the left side panel
Delete Geographic Cluster
- To delete a geographic cluster, select that geographic cluster on the left side panel or on the map area, then click the Delete Cluster button below the Edit Cluster button. Click Save to confirm the deletion or click Cancel if you don't want to delete anymore
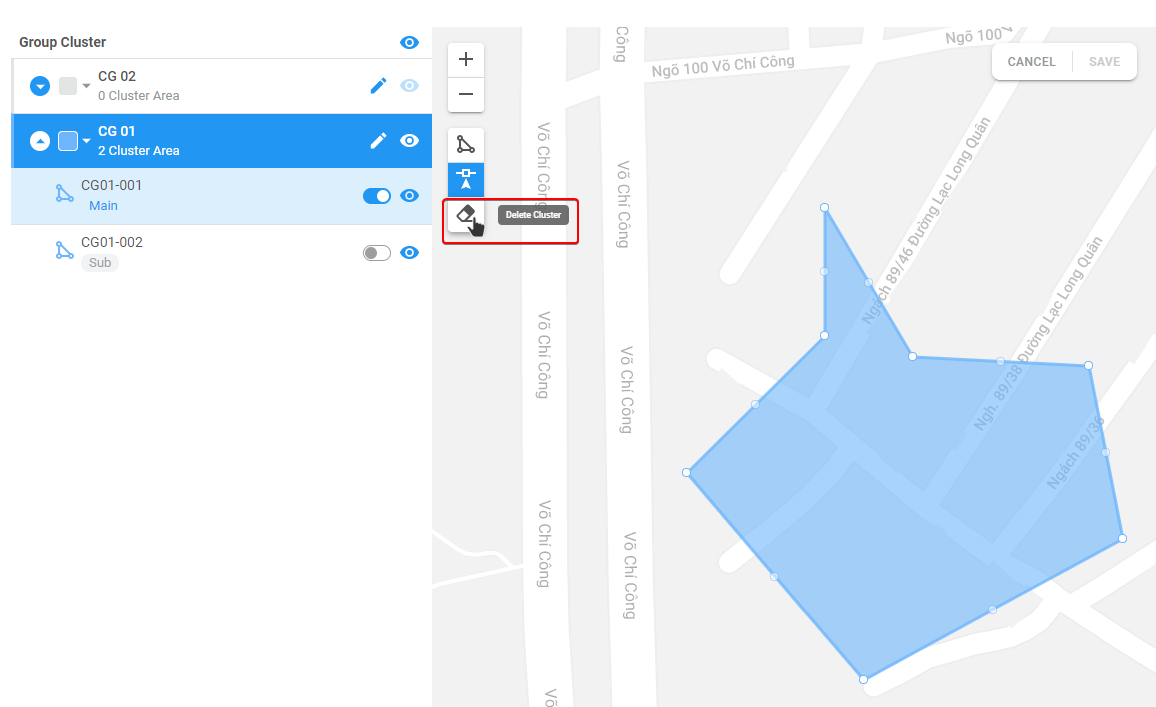
Illustration (English)
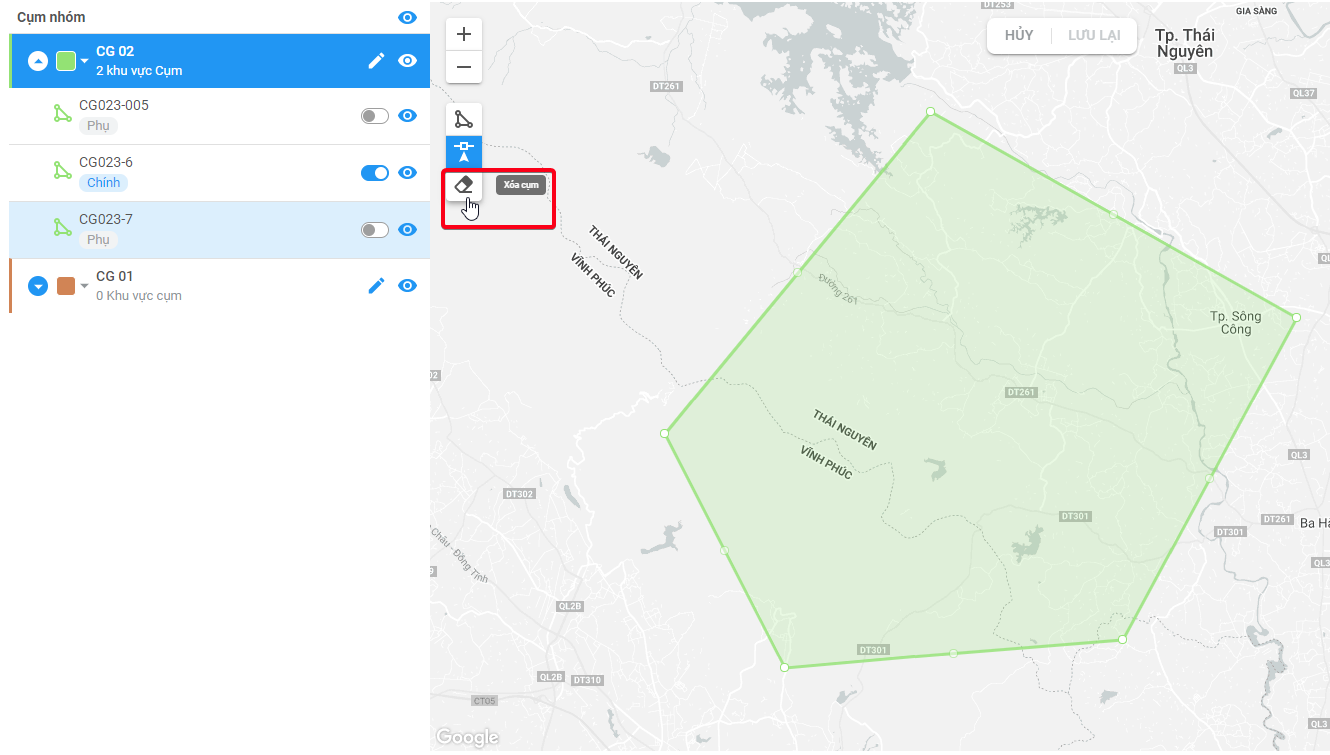
Illustration (Vietnamese)
Change Geographic Cluster Color
- To change the color of a Customer Group's Geographic Clusters, click the color thumbnail on the Customer Group name's left on the left side panel. The color box will appear. You can click on any of the pre-defined colors. You can also freely select another color by using the color selection bar in combination with the color lightness spectrum. After you have selected the appropriate color, click OK then click Save button on the top middle of the map area to confirm the change
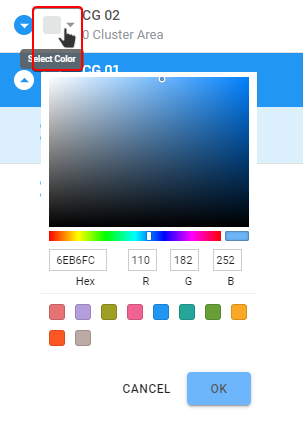
Illustration (English)
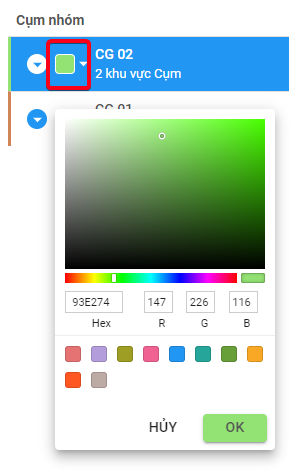
Illustration (Vietnamese)
Navigate back to List View Mode
- To navigate back to the list view mode, click the View List button on the Organization box's left
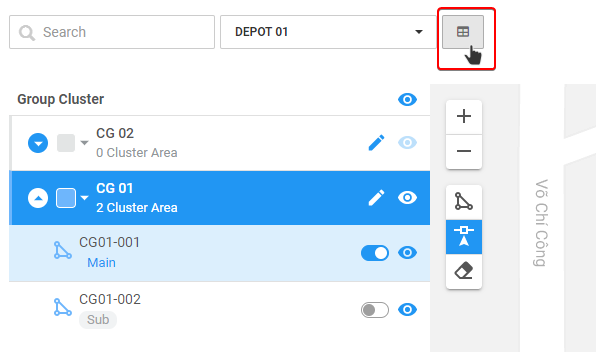
Illustration (English)
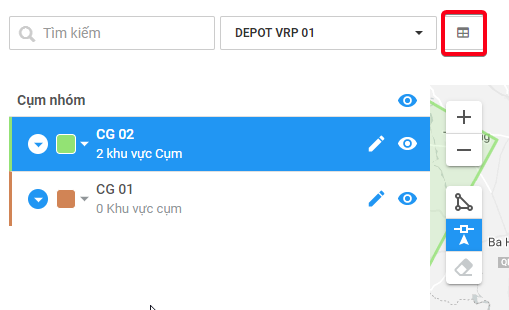
Illustration (Vietnamese)
Route Plan Optimization Process
- During the Route Plan Optimization process, the system will perform the following procedure
- Step 1. Determines the urgency level of the Customer Groups based on their time windows
- In this step, the system will compare the Customer Groups' time windows in pairs of two. After comparing, one Customer Group will be ruled the high urgency Customer Group. The remaining Customer Group will be ruled the low urgency Customer Group. There are two possible scenarios:
- Scenario 1. The two Customer Groups' time windows are totally different or have the same beginning time but different ending times. In this scenario, whichever Customer Group that has its time window's ending time to be earlier than that of the other Customer Group will be ruled the high urgency Customer Group
- Scenario 2. The two Customer Groups' time windows have the same ending time. In this scenario, whichever Customer Group that has its time window's beginning time to be earlier than that of the other Customer Group will be ruled the high urgency Customer Group
- Step 2. Determines the Customers located inside the main geographic clusters, then calculates the total weight of all the Sales Orders in the main geographic clusters
- Step 3. Determines the weight-capacity threshold of each Customer Group's Main geographical cluster, specifically:
- The lower weight-capacity threshold equals the value computed by multiplying the lowest weight-capacity value of the vehicles forwarded to the routing algorithm engine with the Minimum Vehicle Fill Rate (%) value that has been input at the Branch
- For example, among the vehicles forwarded to the routing algorithm engine, the lowest weight-capacity value is 2000 kilograms; the Minimum Vehicle Fill Rate (%) at the Branch is 20 percent. The lower weight-capacity threshold value of the Customer Group's Main geographical cluster, therefore, will be 2000 x 20 % = 400 kilograms
- The upper weight-capacity threshold equals the lowest weight-capacity value of the vehicles forwarded to the routing algorithm engine
- For example, among the vehicles forwarded to the routing algorithm engine, the lowest weight-capacity value is 2000 kilograms. The upper weight-capacity threshold value of the Customer Group's Main geographical cluster, therefore, will be 2000 kilograms
- The weight-capacity threshold of the Customer Group's Main geographical cluster, therefore, will be 400 to 2000 kilograms
- Step 4. Categorize the high and low urgency main geographical clusters into three types based on the total Sales Orders' weight of each cluster, specifically:
- Type 1: Overload main geographical clusters: The main geographical clusters of which the total Sales Orders' weight is larger than its upper weight threshold
- Type 2: Underload main geographical clusters: The main geographical clusters of which the total Sales Orders' weight is smaller than its lower weight threshold
- Type 3: Adequate main load geographical clusters: The main geographical clusters of which the total Sales Orders' weight is within its weight threshold range
- Step 5. Process the high urgency main geographic clusters. To be specific, in this step, the system will attempt to achieve the following goals:
- 1 - Assigns the vehicles for the high urgency main geographical clusters on a one-on-one basis, one high urgency main geographical cluster will be delivered by only one vehicle
- 2 - Redistributes Orders from the Overload and Adequate load geographical clusters to the high urgency Underload main geographical clusters, making all of them Adequate load main geographical clusters
- To achieve these goals, the system will perform several sub-steps
- Step 5.1 Process each high urgency Underload main geographical clusters. There are two scenarios:
- Scenario 1. If the high urgency Underload main geographical cluster being processed has an associated Overload geographical cluster (Regardless of whether it is high urgency or low urgency), the system will try to redistribute Orders from that associated Overload geographical cluster to the high urgency Underload main geographical clusters, making all of them Adequate load geographical clusters
- Next, the system will sequentially process the sub geographical clusters of that high urgency Underload main geographical cluster (The sub geographical clusters locate inside the associated Overload geographical clusters). The system will try to redistribute the Customers located in the sub geographical clusters to the high urgency Underload main geographical clusters. The system will not redistribute if it indicates that after doing so the associated Overload geographical clusters will become Underload or the high urgency Underload main geographical cluster will become Overload
- Scenario 2. If the high urgency Underload main geographical cluster being processed has an associated Adequate load geographical cluster (Regardless of whether it is high urgency or low urgency), the system will try to redistribute Orders from the associated Adequate load geographical clusters to the high urgency Underload main geographical clusters, making all of them Adequate load geographical clusters
- Next, the system will sequentially process the sub geographical clusters of that high urgency Underload main geographical cluster (The sub geographical clusters locate inside the associated Adequate load geographical clusters). The system will try to redistribute the Customers located in the sub geographical clusters to the high urgency Underload main geographical clusters. The system will not redistribute if it indicates that after doing so the associated Adequate load geographical clusters will become Underload or the high urgency Underload main geographical cluster will become Overload. The system will still redistribute if it indicates that after doing so the associated Adequate load main geographical cluster will have zero Customers left after the redistribution
- Step 5.2 Process each high urgency Overload main geographical clusters
- If the high urgency Overload main geographical cluster being processed has an associated Adequate load geographical cluster, the system will try to redistribute Orders from that high urgency Overload main geographical cluster to its associated Adequate load geographical cluster, making all of them Adequate load geographical clusters
- Next, the system will sequentially process the sub geographical clusters of the associated Adequate load geographical cluster (The sub geographical clusters locate inside the high urgency Overload geographical cluster being processed). The system will try to redistribute the Customers located in the sub geographical clusters to the associated Adequate load geographical cluster. The system will not redistribute if it indicates that after doing so the associated Adequate load geographical cluster will become Overload or the high urgency Overload main geographical cluster will become Underload
- Step 5.3 After the system has finished processing the high urgency main geographical clusters, there might still exist all three types: Overload, Underload, and Adequate load clusters. If this is the case, the system will sequentially perform the following:
- With the high urgency Overload main geographical clusters: Assigns enough vehicles and marks the assigned vehicles as utilized for the Delivery Trip (Let's call this Delivery Trip 1). If there are not enough vehicles, the system will treat the Orders of some Customers located inside those high urgency Overload main geographical clusters as Unplanned (Missing) Orders
- With the high urgency Adequate load main geographical clusters: Assigns enough vehicles and marks the assigned vehicles as utilized for the Delivery Trip 1. If there are not enough vehicles, the system will treat the Orders of some Customers located inside those high urgency Adequate load main geographical clusters as Unplanned (Missing) Orders
- With the high urgency Underload load main geographical clusters: Treat all Orders of the Customers located inside these geographical clusters as Unplanned (Missing) Orders
- Step 6. Process the low urgency main geographic clusters. To be specific, in this step, the system will attempt to achieve the following goal: Assigns the vehicles for the low urgency main geographical clusters on a one-on-one basis, one low urgency main geographical cluster will be delivered by only one vehicle
- To achieve this goal, the system will perform several sub-steps
- Step 6.1 Process each low urgency Underload main geographical clusters. There are two scenarios:
- Scenario 1. If the low urgency Underload main geographical cluster being processed has an associated Overload geographical cluster (Regardless of whether it is high urgency or low urgency), the system will try to redistribute Orders from that associated Overload geographical cluster to the low urgency Underload main geographical cluster, making all of them Adequate load geographical clusters
- Next, the system will sequentially process the sub geographical clusters of that high urgency Underload main geographical cluster (The sub geographical clusters locate inside the associated Overload geographical clusters). The system will try to redistribute the Customers located in the sub geographical clusters to the high urgency Underload main geographical clusters. The system will not redistribute if it indicates that after doing so the associated Overload geographical clusters will become Underload or the high urgency Underload main geographical cluster will become Overload
- Scenario 2. If the high urgency Underload main geographical cluster being processed has an associated Adequate load geographical cluster (Regardless of whether it is high urgency or low urgency), the system will try to redistribute Orders from the associated Adequate load geographical clusters to the high urgency Underload main geographical clusters, making all of them Adequate load geographical clusters
- Next, the system will sequentially process the sub geographical clusters of that high urgency Underload main geographical cluster (The sub geographical clusters locate inside the associated Overload geographical clusters). The system will try to redistribute the Customers located in the sub geographical clusters to the low urgency Underload main geographical clusters. The system will not redistribute if it indicates that after doing so the associated Overload geographical clusters will become Underload or the low urgency Underload main geographical cluster will become Overload
- Step 6.2 Process each low urgency Overload main geographical clusters
- If the low urgency Overload main geographical cluster being processed has an associated Adequate load geographical cluster, the system will try to redistribute Orders from that low urgency Overload main geographical cluster to its associated Adequate load geographical cluster, making all of them Adequate load geographical clusters
- Next, the system will sequentially process the sub geographical clusters of the associated Adequate load geographical cluster (The sub geographical clusters locate inside the low urgency Overload geographical cluster being processed). The system will try to redistribute the Customers located in the sub geographical clusters to the associated Adequate load geographical cluster. The system will not redistribute if it indicates that after doing so the associated Adequate load geographical cluster will become Overload or the low urgency Overload main geographical cluster will become Underload
- Step 6.3 After the system has finished processing the low urgency main geographical clusters, there might still exist all three types: Overload, Underload, and Adequate load clusters. If this is the case, the system will sequentially perform the following:
- Step 6.3.1 With the low urgency Overload main geographical clusters, there are two scenarios:
- Scenario 1. There are new vehicles (Vehicles that have not been utilized for Delivery Trip 1). The system will try to assign enough new vehicles. If there are not enough new vehicles, the system will prioritize the new vehicles for the low urgency Overload main geographical clusters of which exist high urgency Customers (Customers who have the same time window attribute as the high urgency main geographical clusters). If the new vehicles do not have enough capacity, the system will try to assign the Orders to the vehicles that have been utilized for Delivery Trip 1 of the associated high associated geographical clusters. The system will make new Delivery Trips for these vehicles if necessary. The system will find the vehicles which have the lowest weight capacity from the ones utilized for Delivery Trip 1
- Scenario 2. There are no new vehicles. The system will prioritize the high urgency Customers by trying to assign the vehicles utilized for Delivery Trip 1 of the associated high associated geographical clusters to deliver for these Customers. The system will make new Delivery Trips for these vehicles if necessary. The system will find the vehicles which have the lowest weight capacity from the ones utilized for Delivery Trip 1
- If the system can not do perform any of the above, it will treat some Orders as Unplanned (Missing) Orders
- Step 6.3.2 With the low urgency Underload and Adequate load main geographical clusters, there are two scenarios:
- Scenario 1. There are new vehicles (Vehicles that have not been utilized for Delivery Trip 1). The system will try to assign enough new vehicles. If there are not enough new vehicles, the system will prioritize to assign the new vehicles for the low urgency Underload and Adequate load main geographical clusters of which exist high urgency Customers (Customers who have the same time window attribute as the high urgency main geographical clusters). If the new vehicles do not have enough capacity, the system will try to assign the Orders to the vehicles that have been utilized for Delivery Trip 1 of the associated high associated geographical clusters. The system will make new Delivery Trips for these vehicles if necessary. The system will find the vehicles which have the lowest weight capacity from the ones utilized for Delivery Trip 1
- Scenario 2. There are no new vehicles. The system will prioritize the high urgency Customers by trying to assign the vehicles utilized for Delivery Trip 1 of the associated high associated geographical clusters to deliver for these Customers. The system will make new Delivery Trips for these vehicles if necessary. The system will find the vehicles which have the lowest weight capacity from the ones utilized for Delivery Trip 1
- If the system can not do perform any of the above, it will treat some Orders as Unplanned (Missing) Orders
Partner Clustering
Incompatibility Warning
- Currently, this configuration CAN NOT be concurrently enabled with any of the following configurations:
- Use Cold Chain
- Odd Even Policy
- Flexible Vehicle Type
- Use Service Time
- Dynamic Loading Time
- Lunch Time
- Split Route
- Split Delivery
- Clustering By District
- Use Clustering by Province/District/Town (Use Clustering Auto is compatible)
- Use Familiarity
- Another configuration is Partner Clustering which can help group customers in an area with a close distance to avoid more than one driver transport to the same area. When this configuration is turned on, the optimization process will measure an area within the radius data input into the information field of the branch.
- The radius data must be Positive integer and there will be a pop-up notification show up to notify the users about this
- To use this function, navigate to the Algorithm configuration in the Branch, Select Partner Clustering and insert the Radius data into the information field. After finishing these steps, click on Save to submit the information into the optimization system
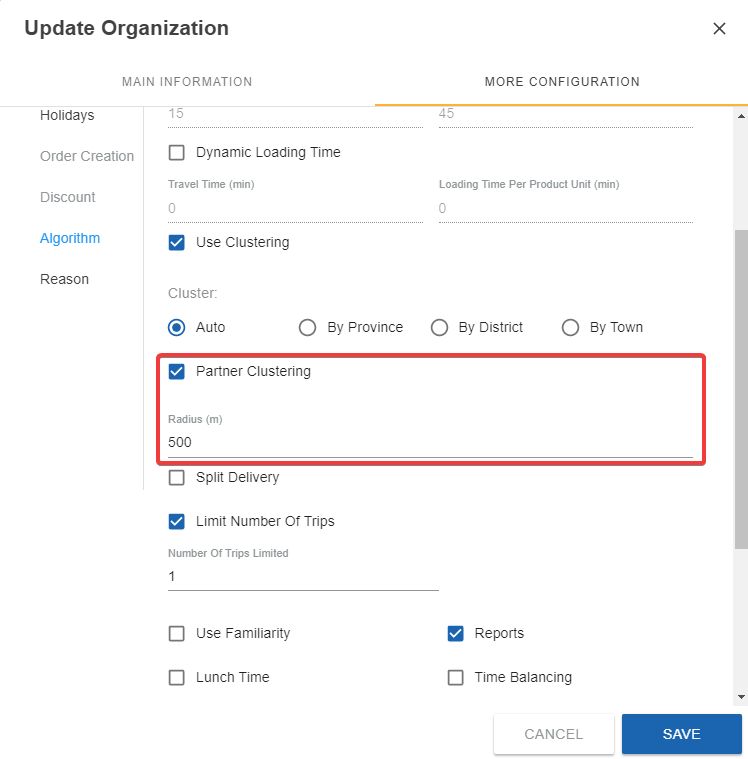
Illustration Image (English)
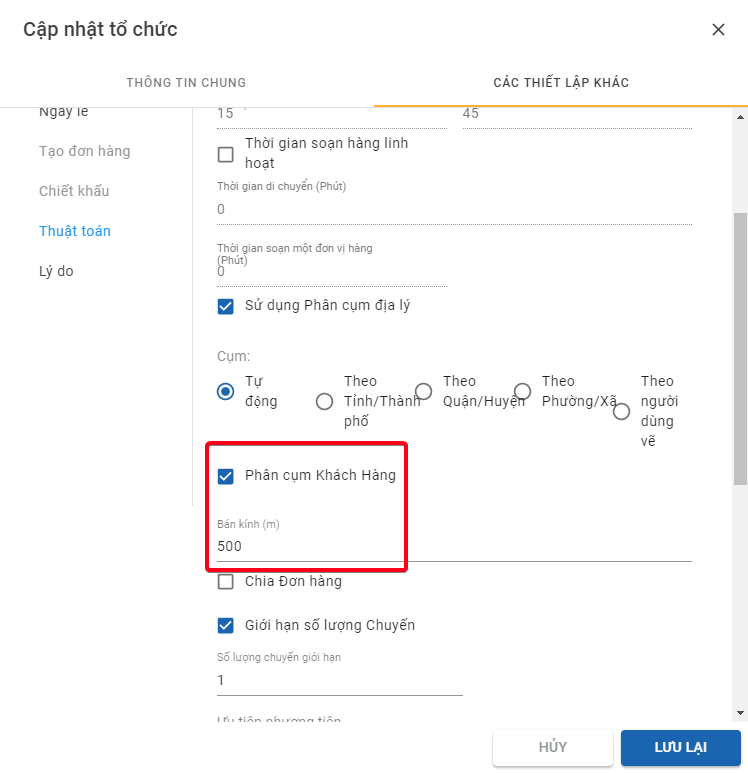
Illustration Image (Vietnamese)
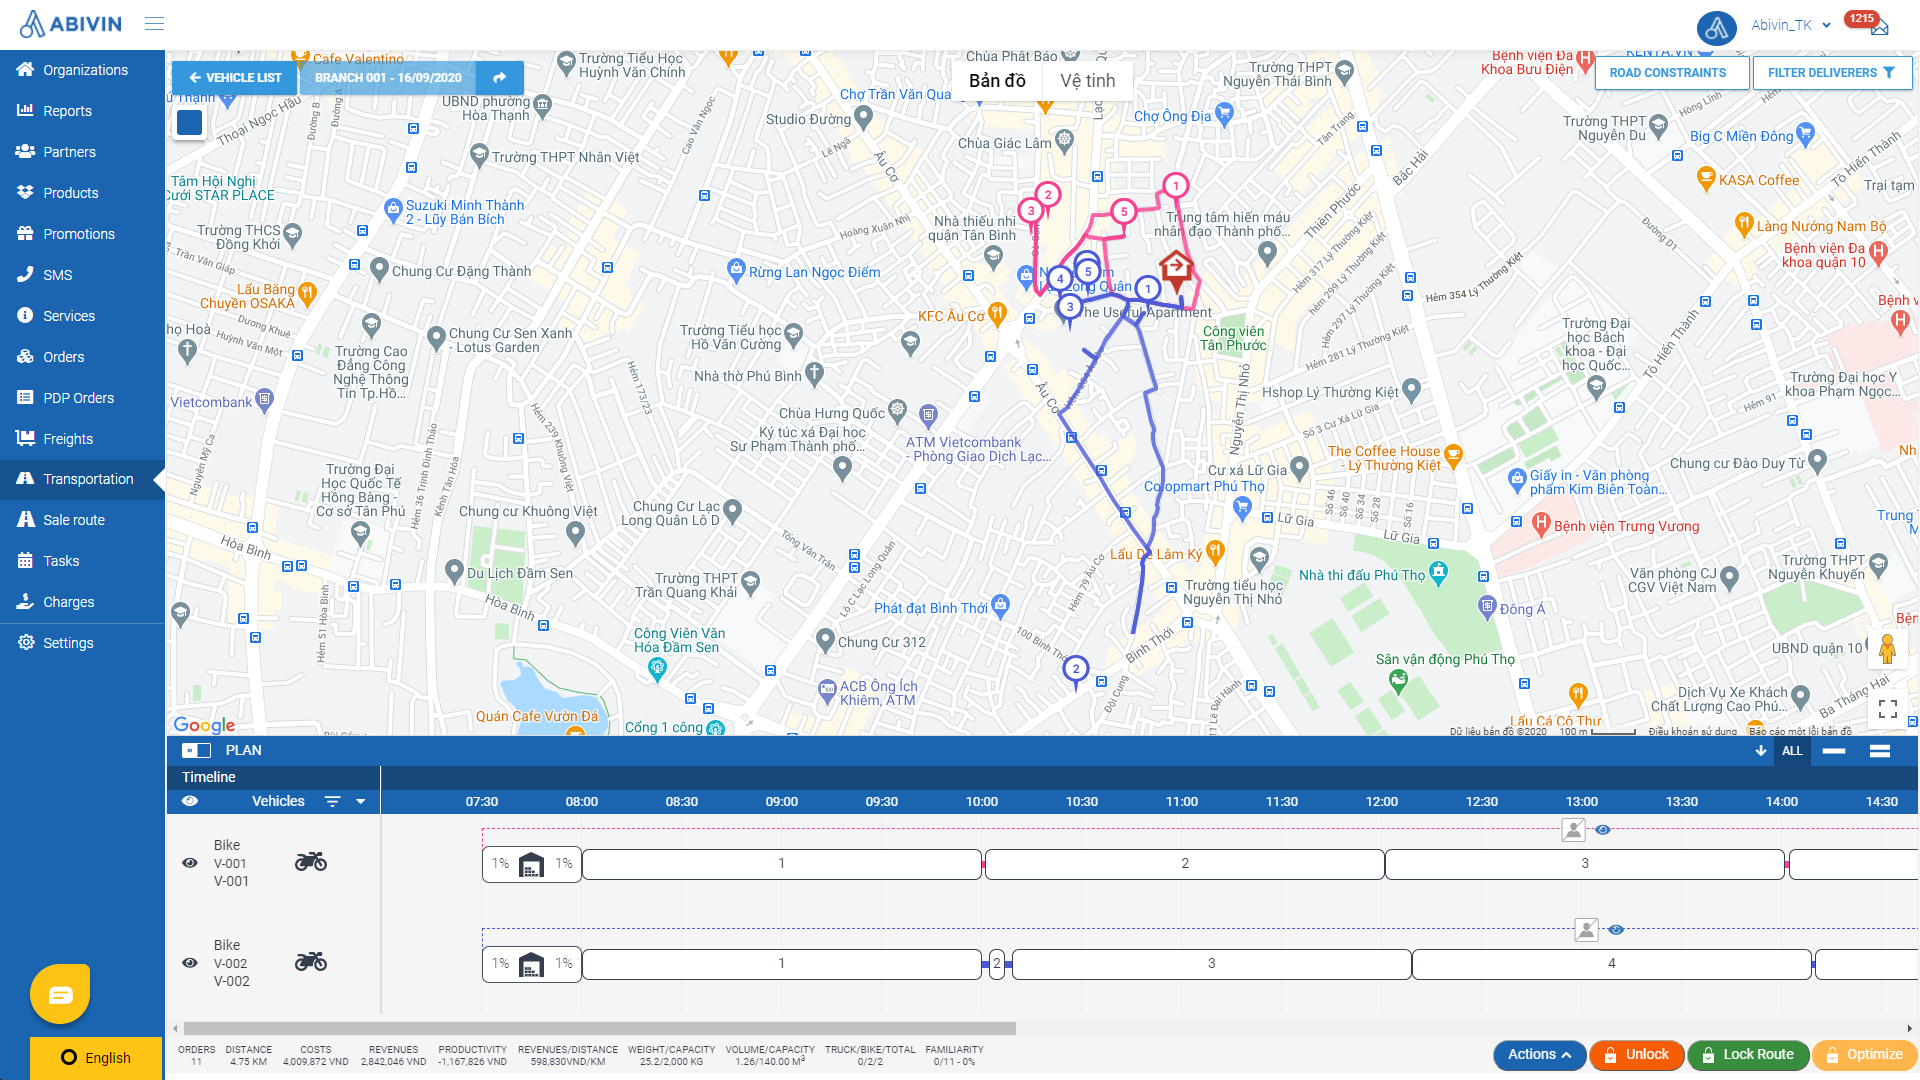
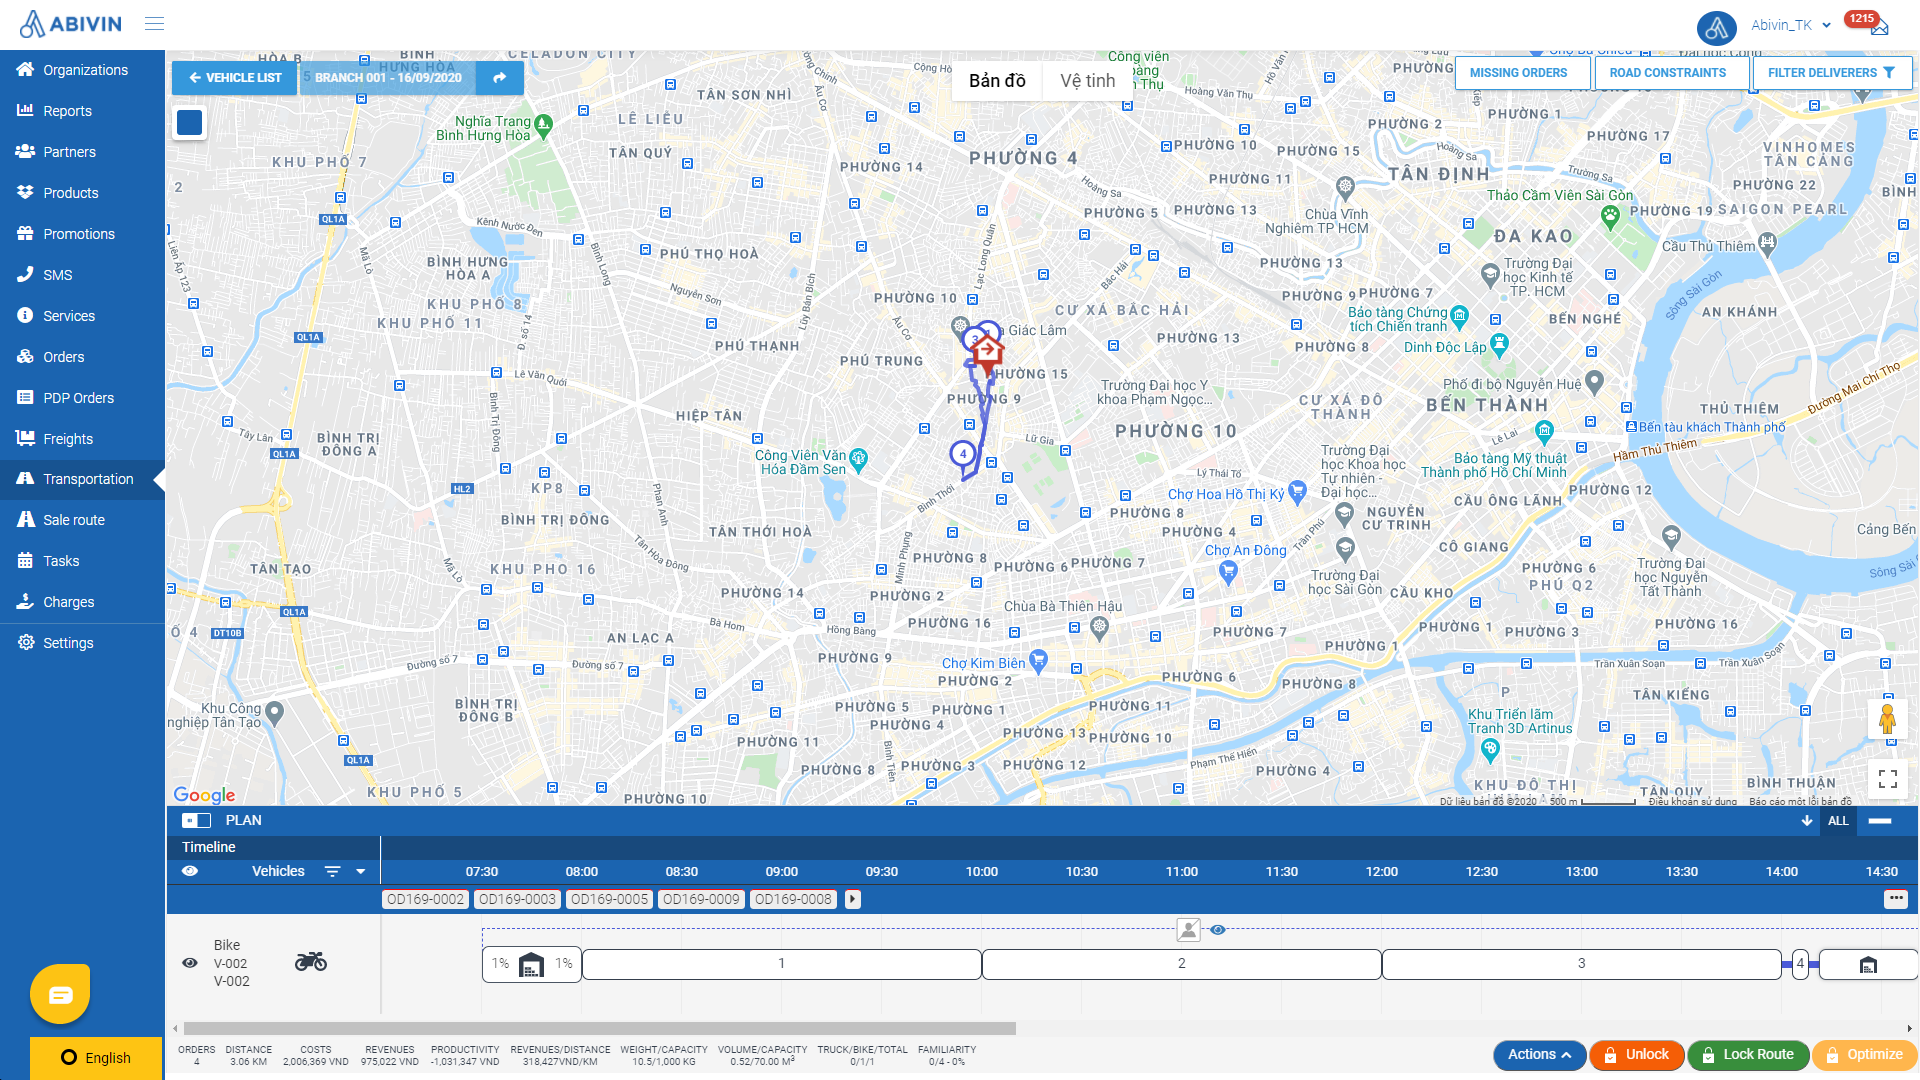
- Specifically, the system will use the radius data input to measure and collect all partners within that area then optimize as usual. The two cases below will describe this configuration:
- The first image is the Route Plan optimization without the Partner Clustering configuration
- The second image is the Partner Clustering configuration with the radius data of 350 metres and in this case, the optimization system after taking 350 metres of radius data into measurement and checking, there will be missing orders compare to the first case without the Partner Clustering configuration. The reason for this is that with a large area taken into consideration, there will be more stores measured by the system so the capacity of the vehicles will be exceeded
Updated 30 days ago
