Vehicle Usage History
- Abivin vRoute system will keep track of how the Vehicles are utilized in the Route Plan optimization process. This article will show you how to view the Vehicle usage history.
- The Vehicle usage history can be accessed through two viewing modes:
- 1 - The default List View mode
- 2 - A more visual viewing mode called Gantt View
Vehicle Usage History (List View)
- The Transportation > Vehicles tab is displayed in the List View mode by default.
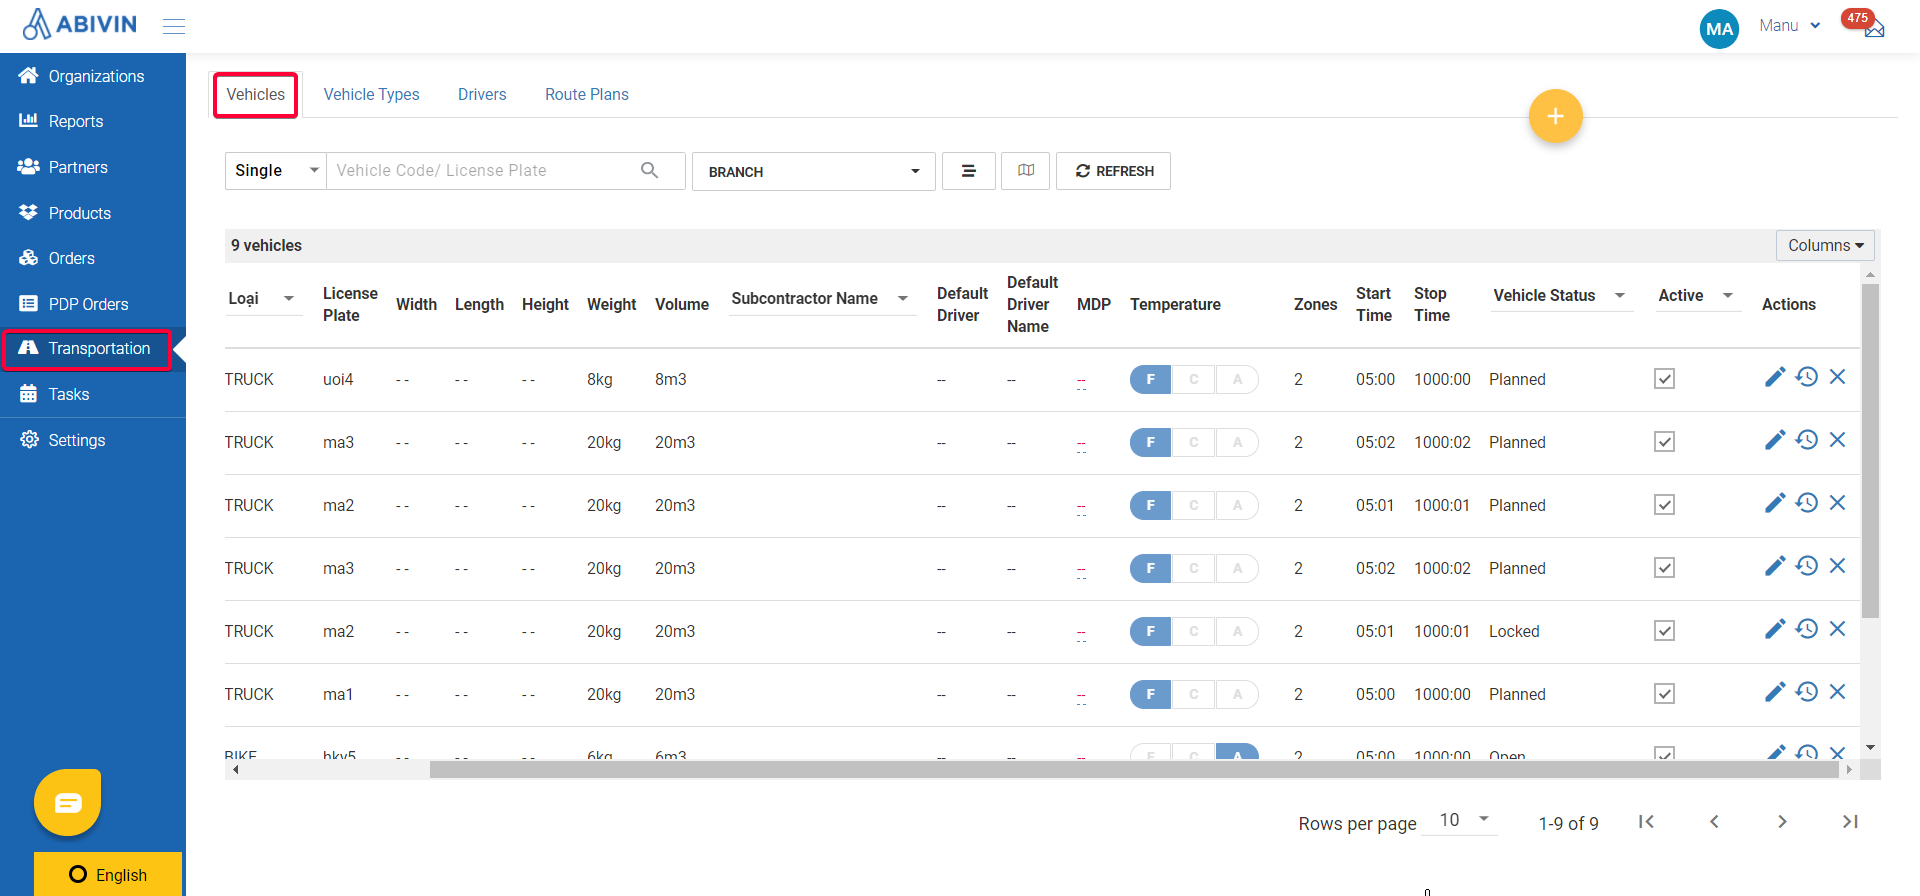
Illustration (English)
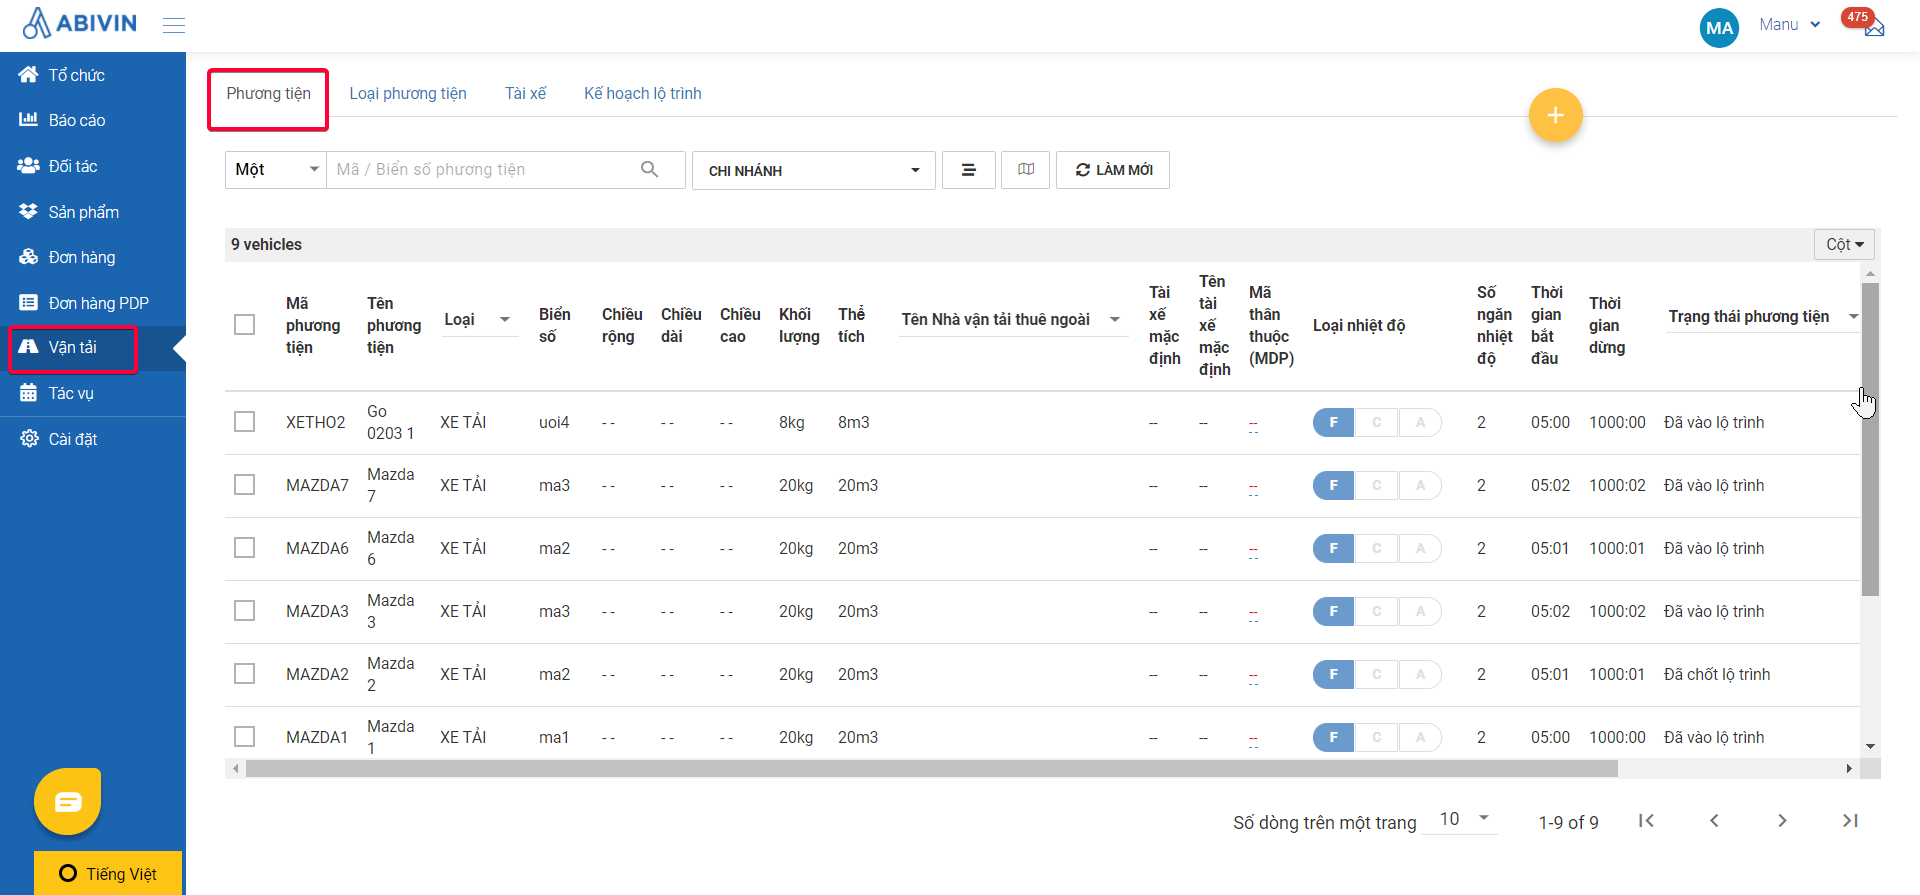
Illustration (Vietnamese)
- In this viewing mode, you can see the usage history of a particular Vehicle by clicking its corresponding Vehicle History icon under the Actions column.
- As you click this icon, the Vehicle History panel will appear on the right side of the screen.
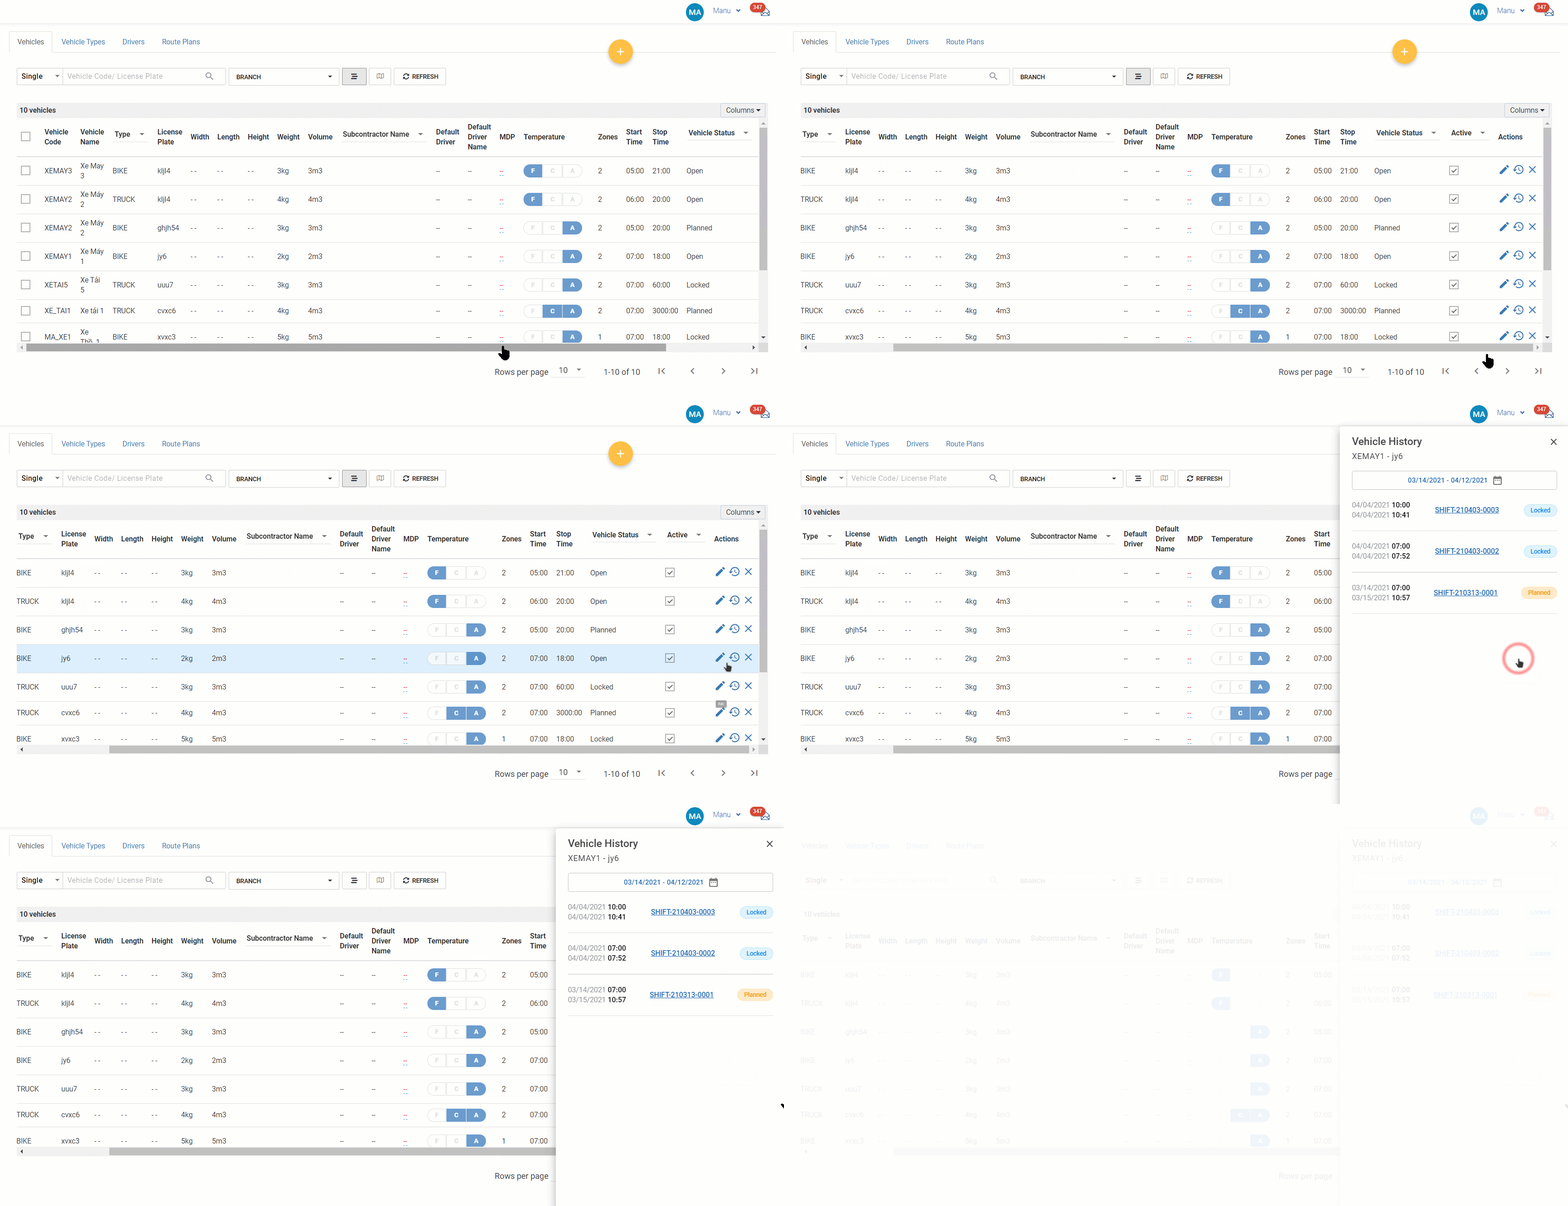
Illustration (English)
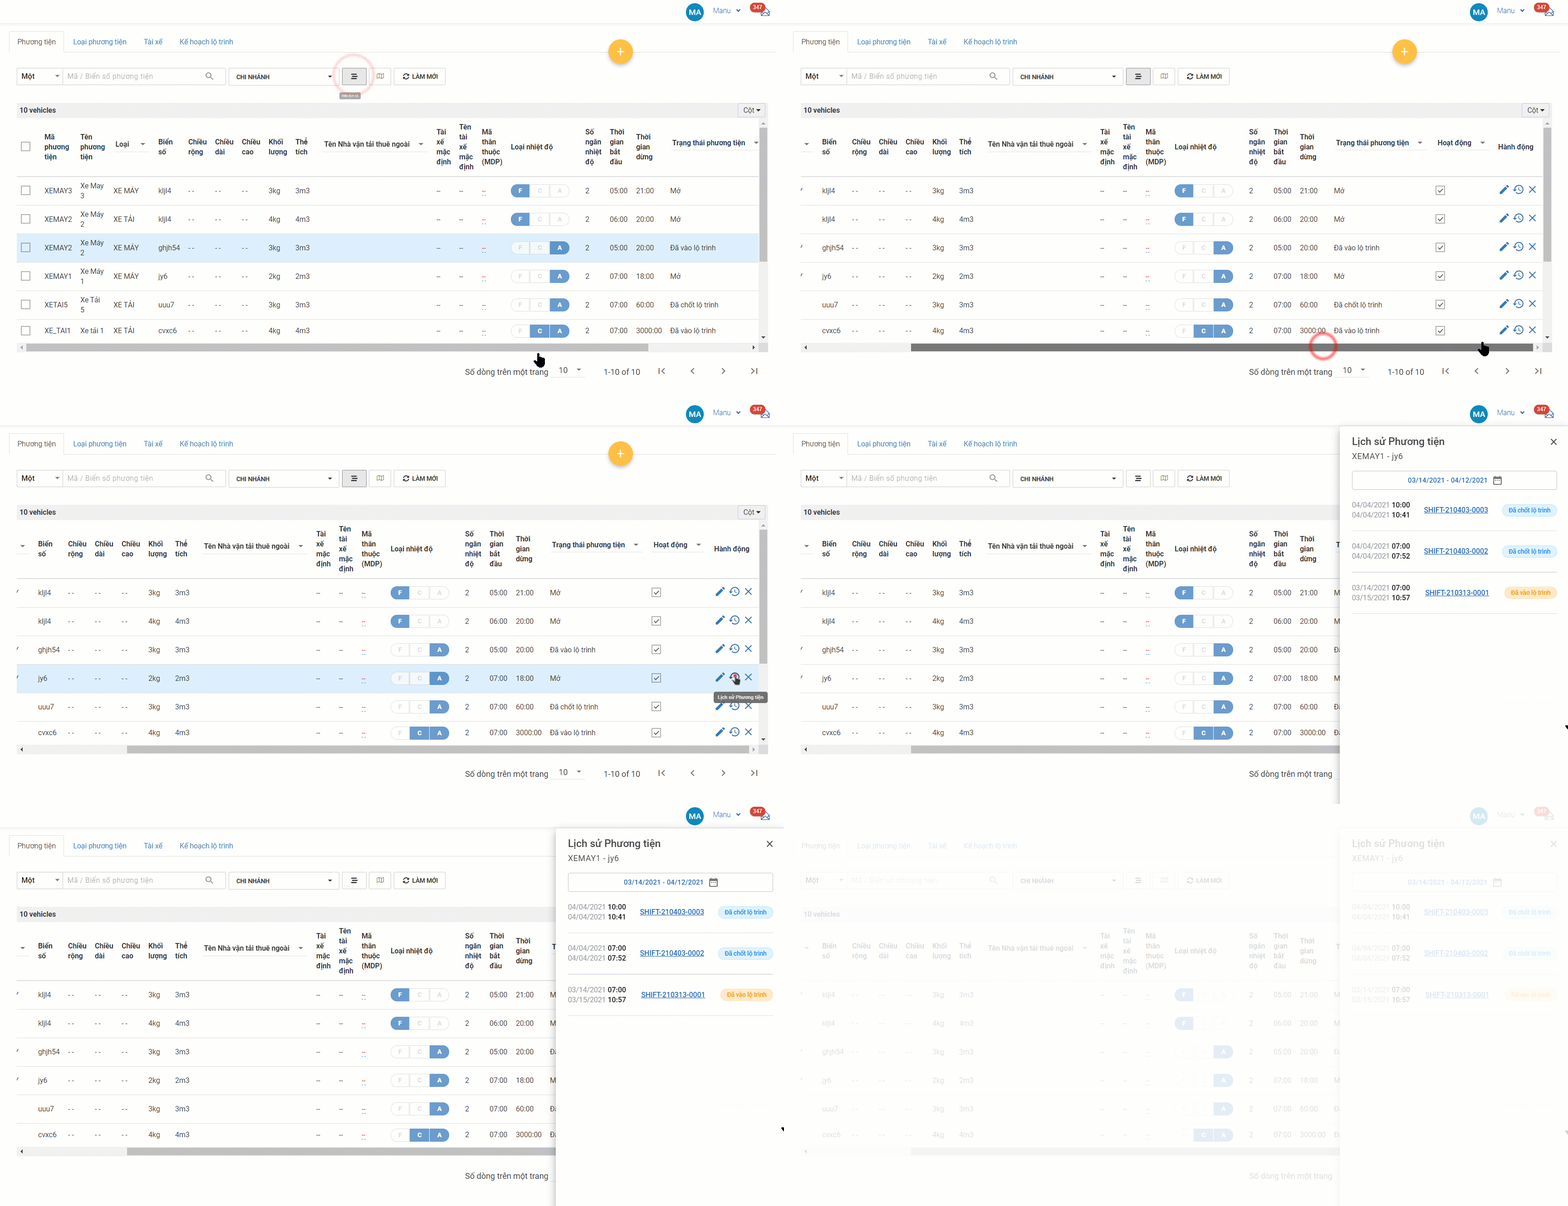
Illustration (Vietnamese)
- By default, this panel will show the usage history of the Vehicle during the most recent 30 days
- To change the date range, click on the date field. On the drop-down calendar, select the new date range (Note: You can only select a maximum of 30 days).
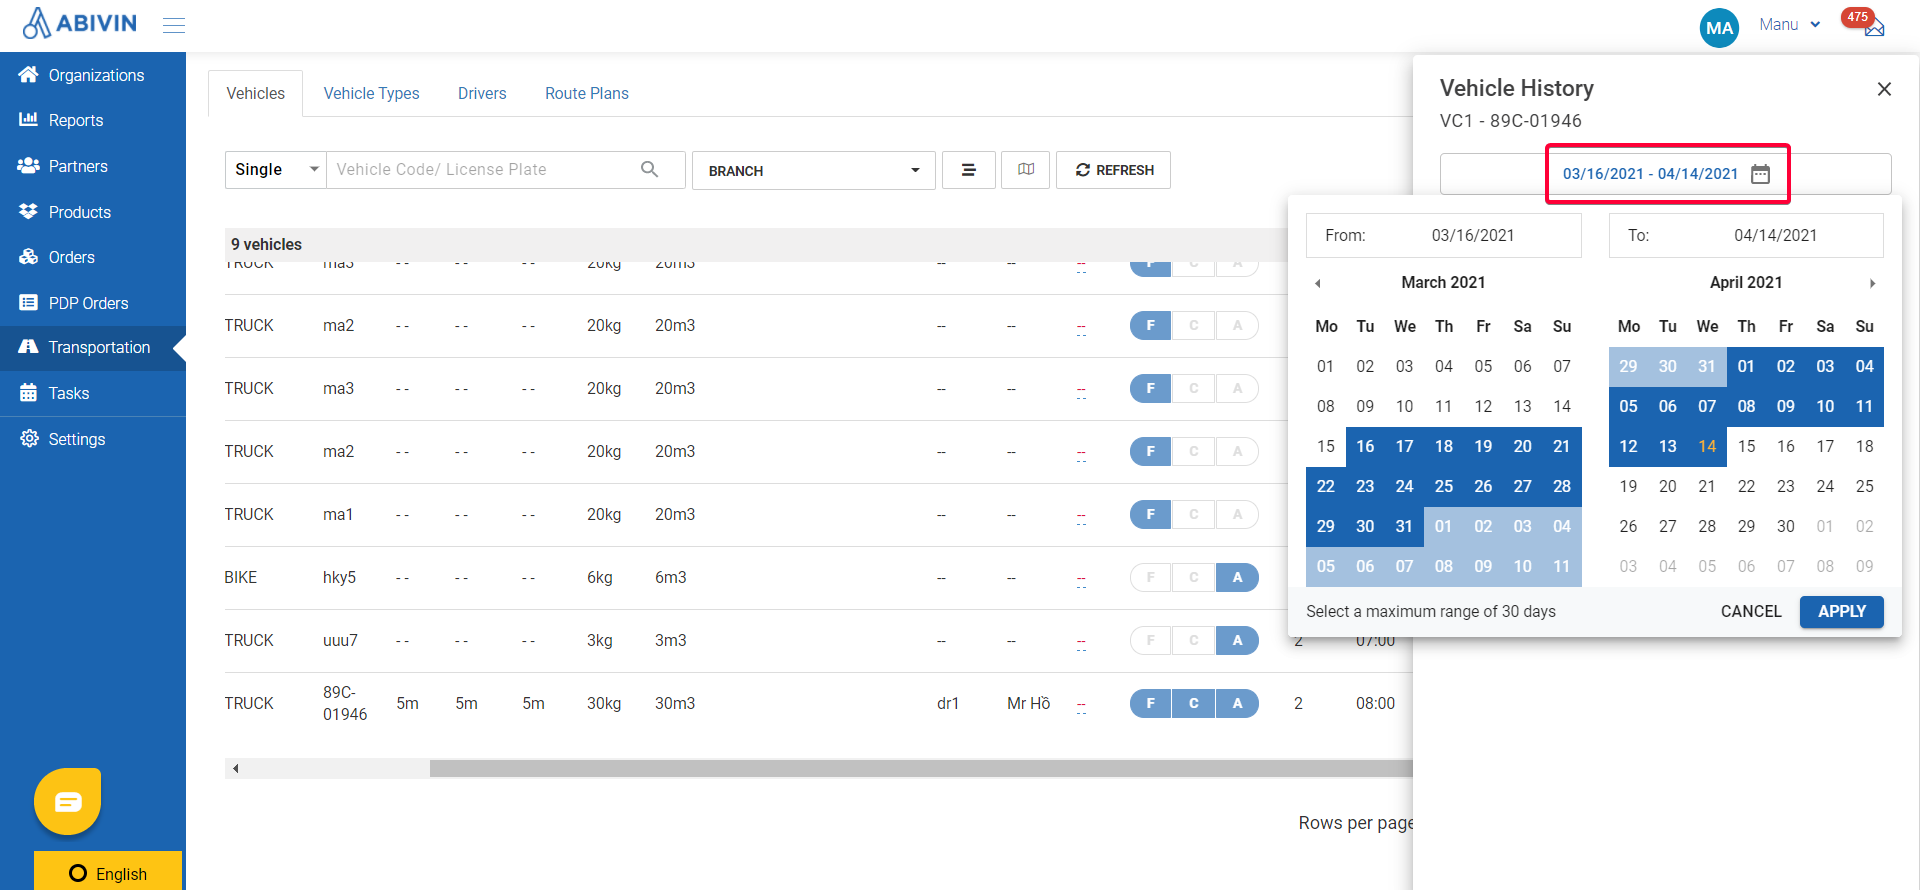
Illustration (English)
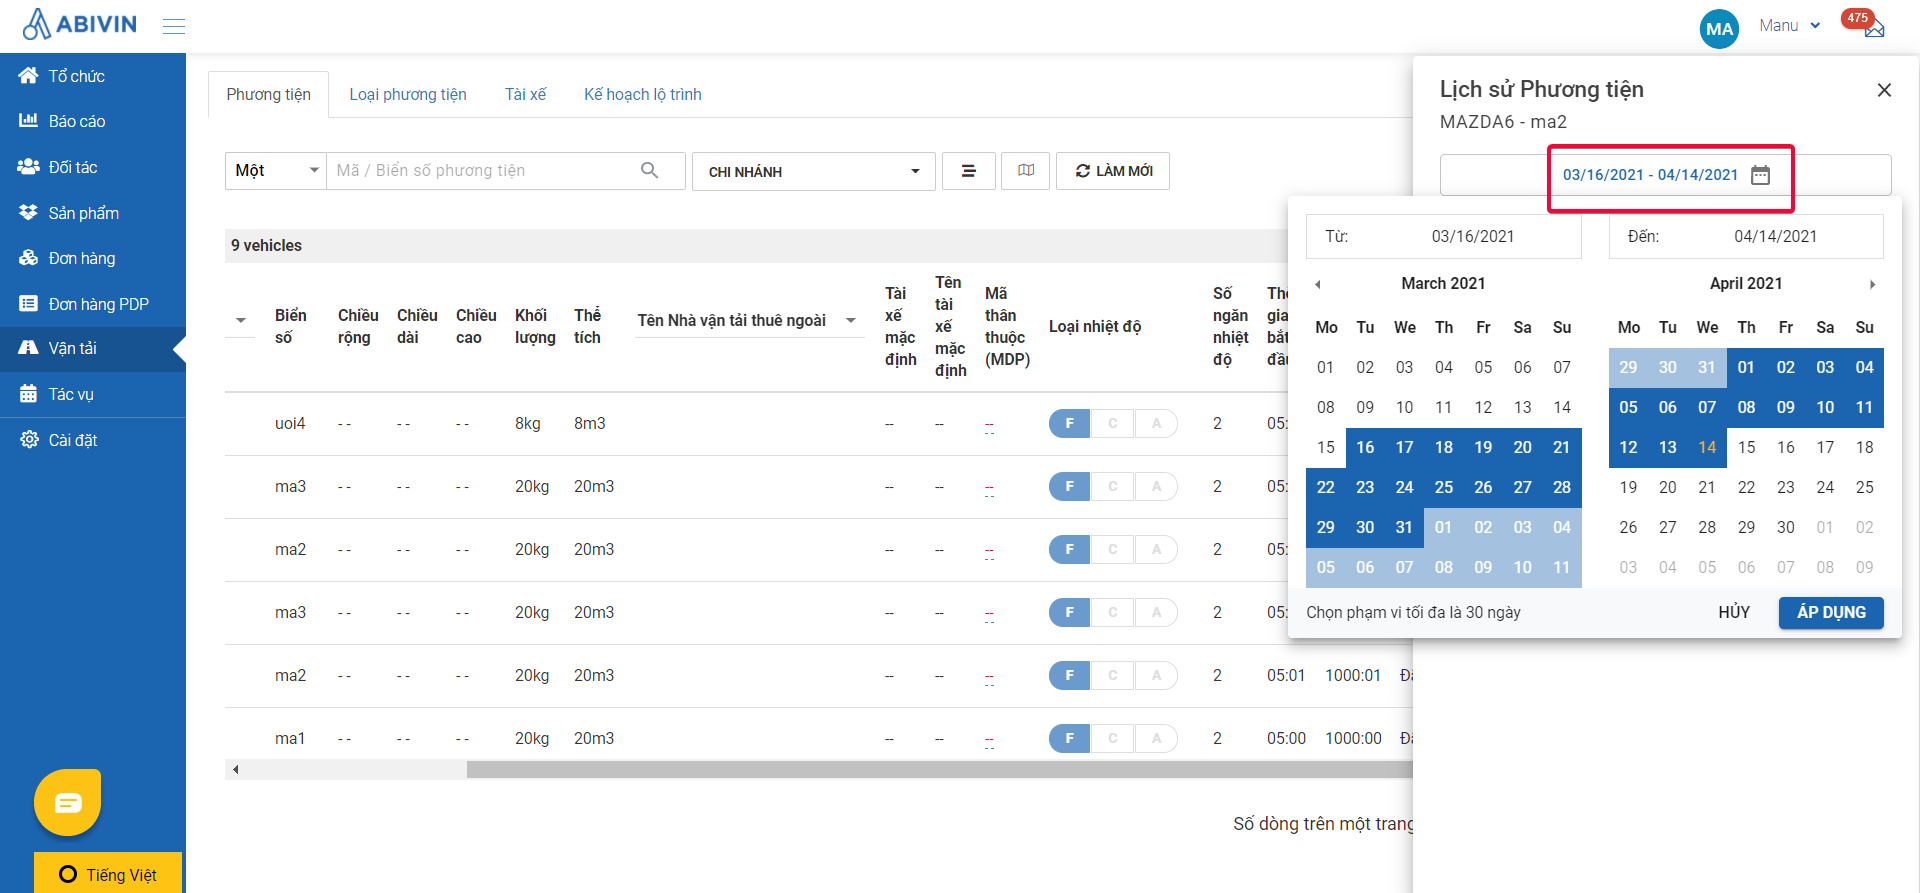
Illustration (Vietnamese)
- If during the selected date range, the Vehicle is utilized in some Route Plans, then its assigned Delivery Shifts will appear below.
- Three information of the Delivery Shifts are displayed:
- 1 - Their Planned Start and Stop Time.
- 2 - Their names in the Route Plan.
- 3 - Their current Planning Status in the Route Plan.
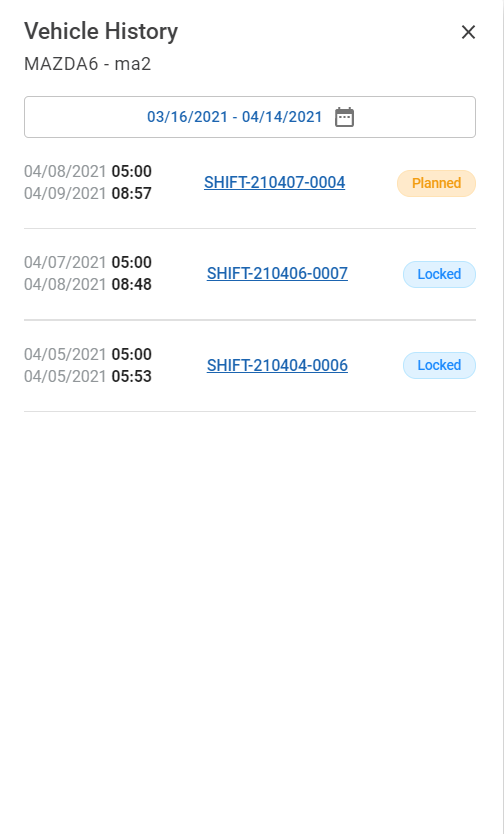
Illustration (English)
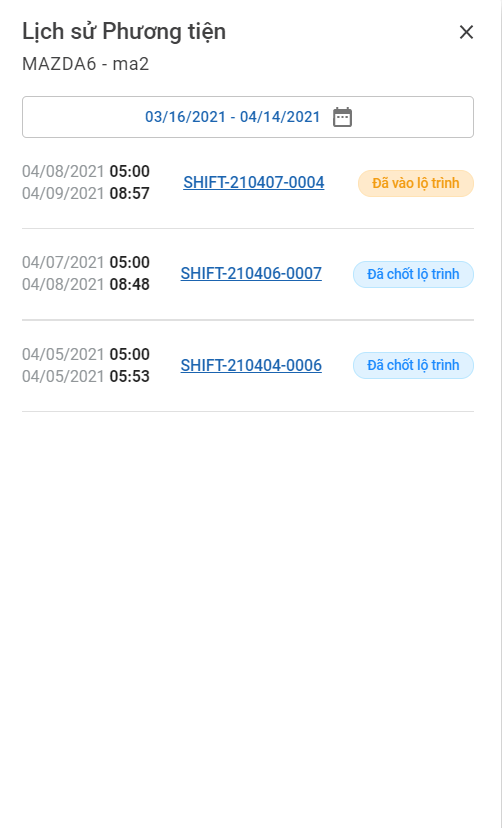
Illustration (Vietnamese)
- If you click on a Delivery Shift name, you will be directed to a new web browser tab showing the Route Plan (Map View). The Delivery Shift will be selected on the Map View.
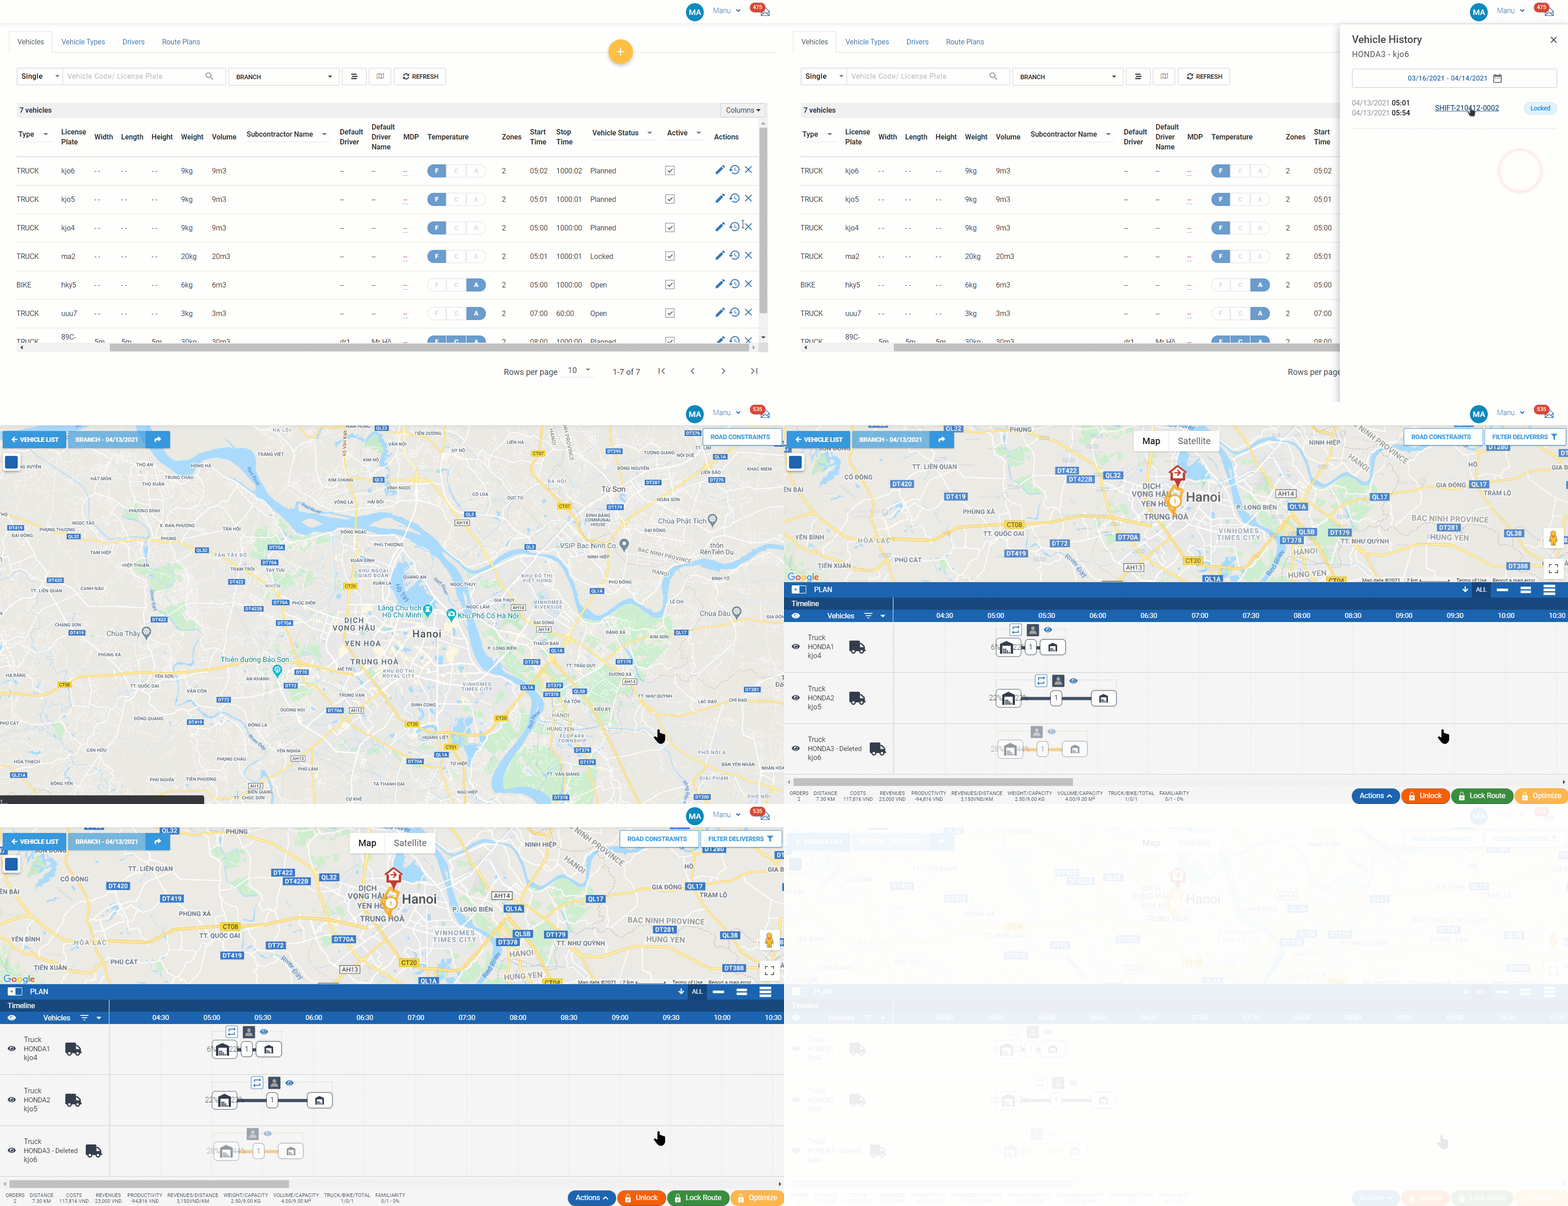
Illustration (English)
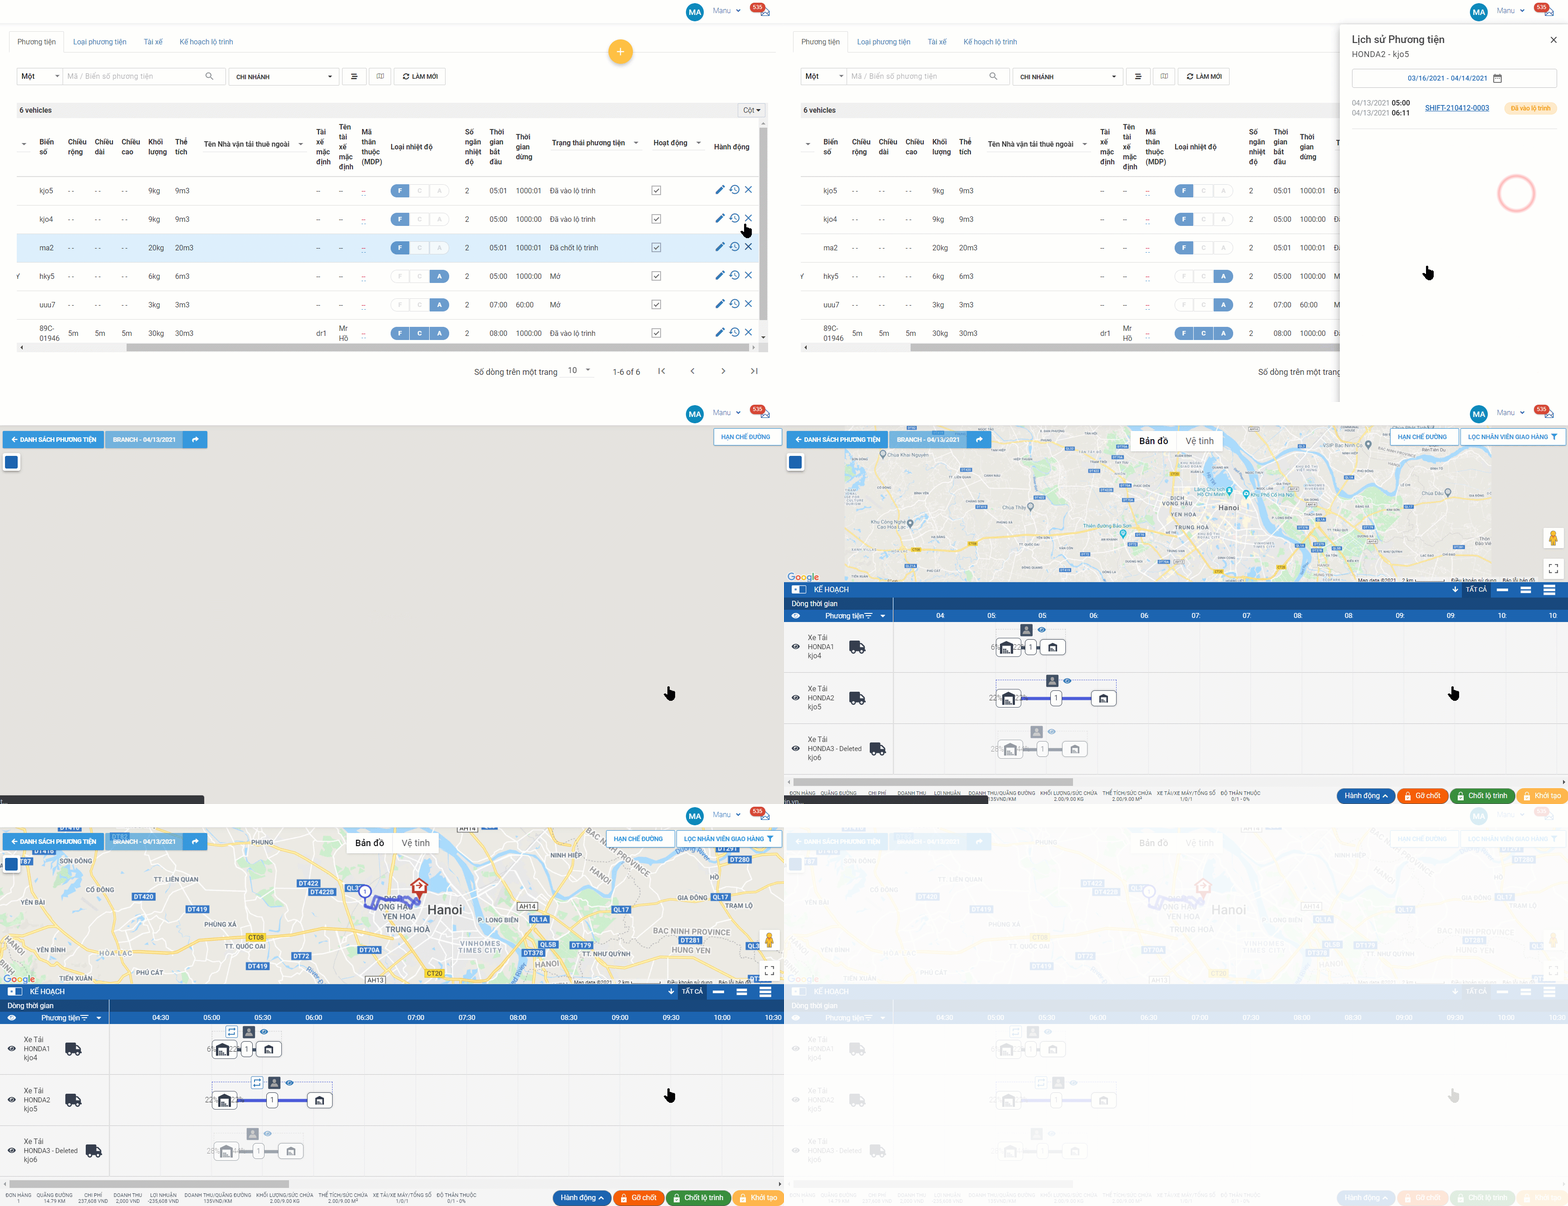
Illustration (Vietnamese)
Vehicle Usage History (Gantt View)
- Apart from the default list view, you can also view the usage history of the Vehicles in a more visual mode called Gantt View.
- To access the Gantt View mode, click the Show History icon on the toolbar.

Illustration (English)

Illustration (Vietnamese)
- To get back to the List View mode, click the Show List icon on the toolbar.

Illustration (English)

Illustration (Vietnamese)
- Generally, the Gantt View mode consists of three sections:
- 1 - The Vehicle Planning Status Bar.
- 2 - The Vehicle Information Table.
- 3 - The Vehicle Usage History Gantt Chart.
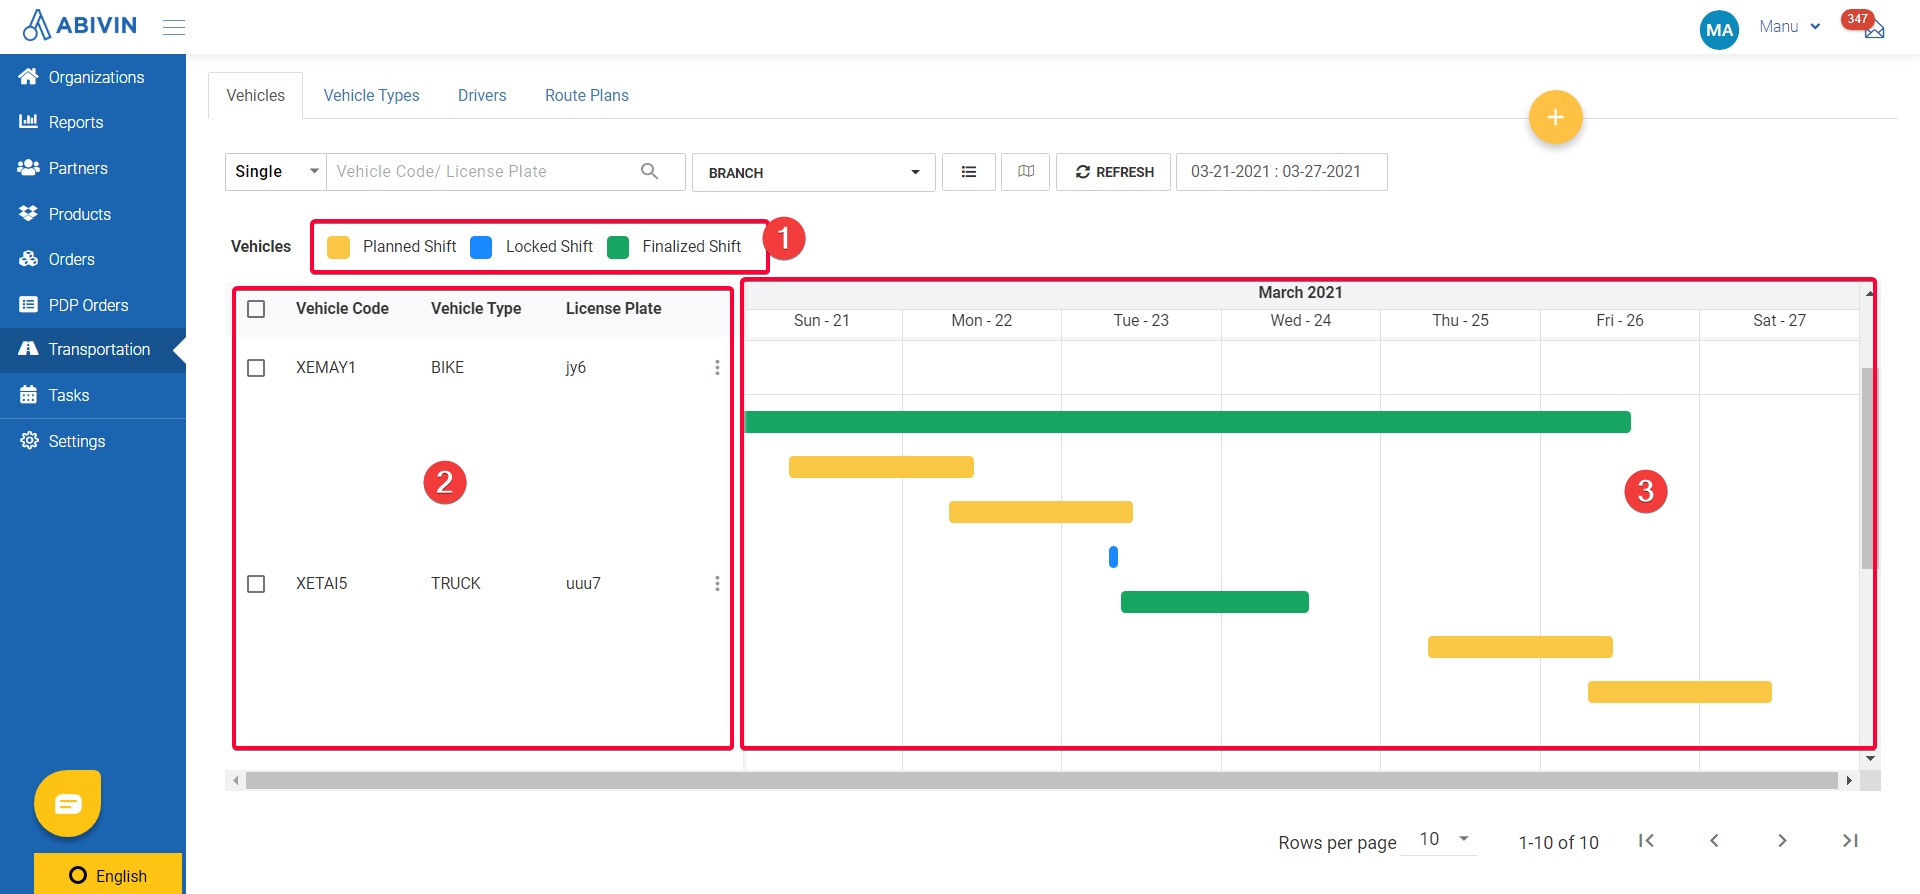
Illustration (English)
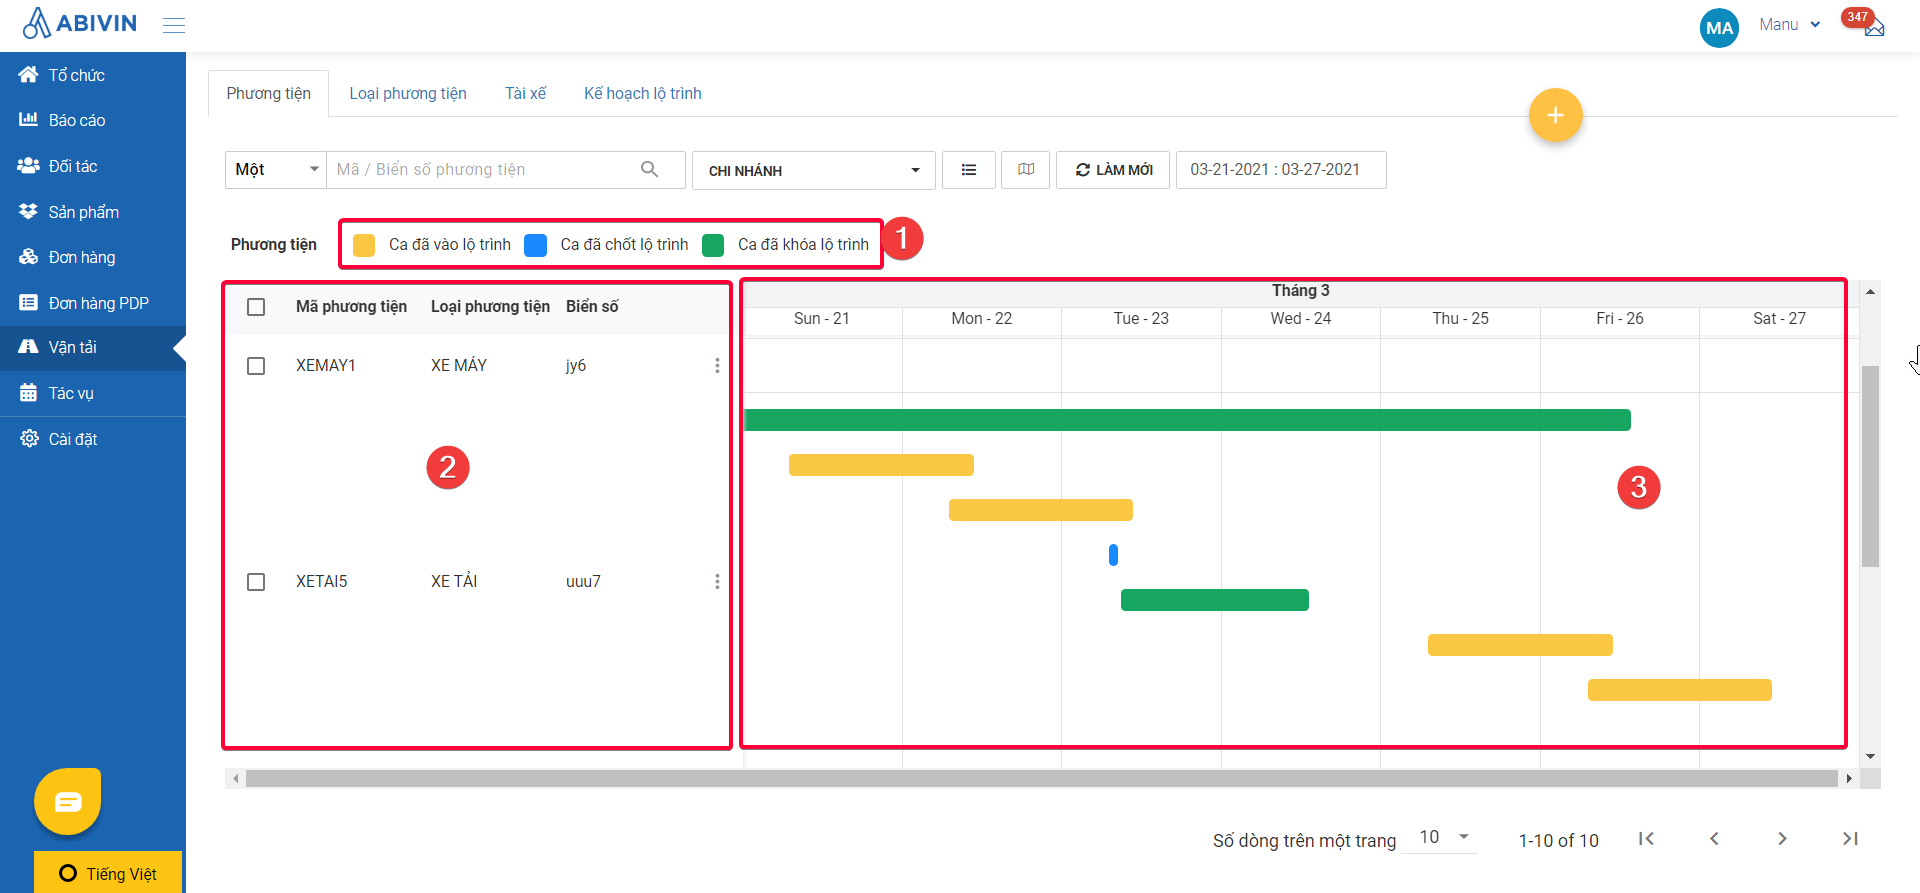
Illustration (Vietnamese)
Vehicle Planning Status Bar
- The Vehicle Planning Status Bar explains the color codes of the Vehicles' Delivery Shifts on the Gantt chart according to their current Planning Status. There are three colors:
- Blue color means the Planning Status of the Delivery Shift is Locked.

- Yellow color means the Planning Status of the Delivery Shift is Planned.

- Green color means the Planning Status of the Delivery Shift is Finalized.

Vehicle Information Table
- The Vehicle Information Table comprises of three following columns:
- 1 - Vehicle Code
- 2 - Vehicle Type
- 3 - License Plate
- After a new Vehicle is created, it will be listed on top of the table.
- On this table, you are able to perform certain operations like on the List View mode:
- Bulk update multiple Vehicles.
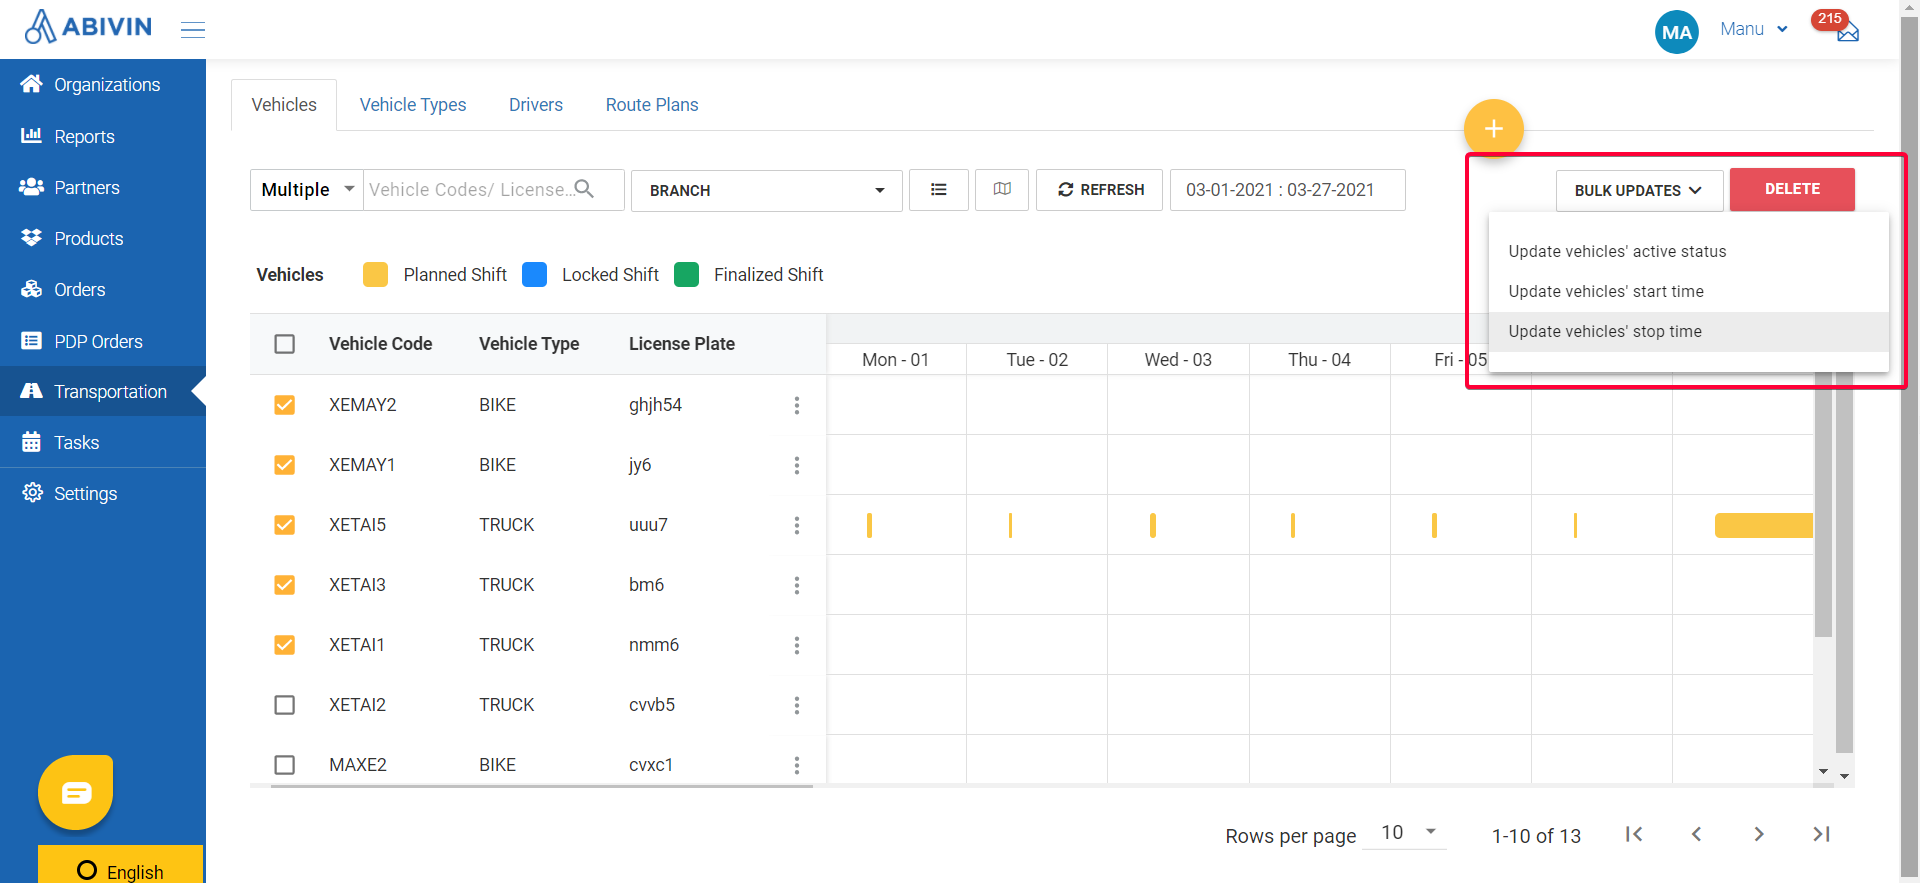
Illustration (English)
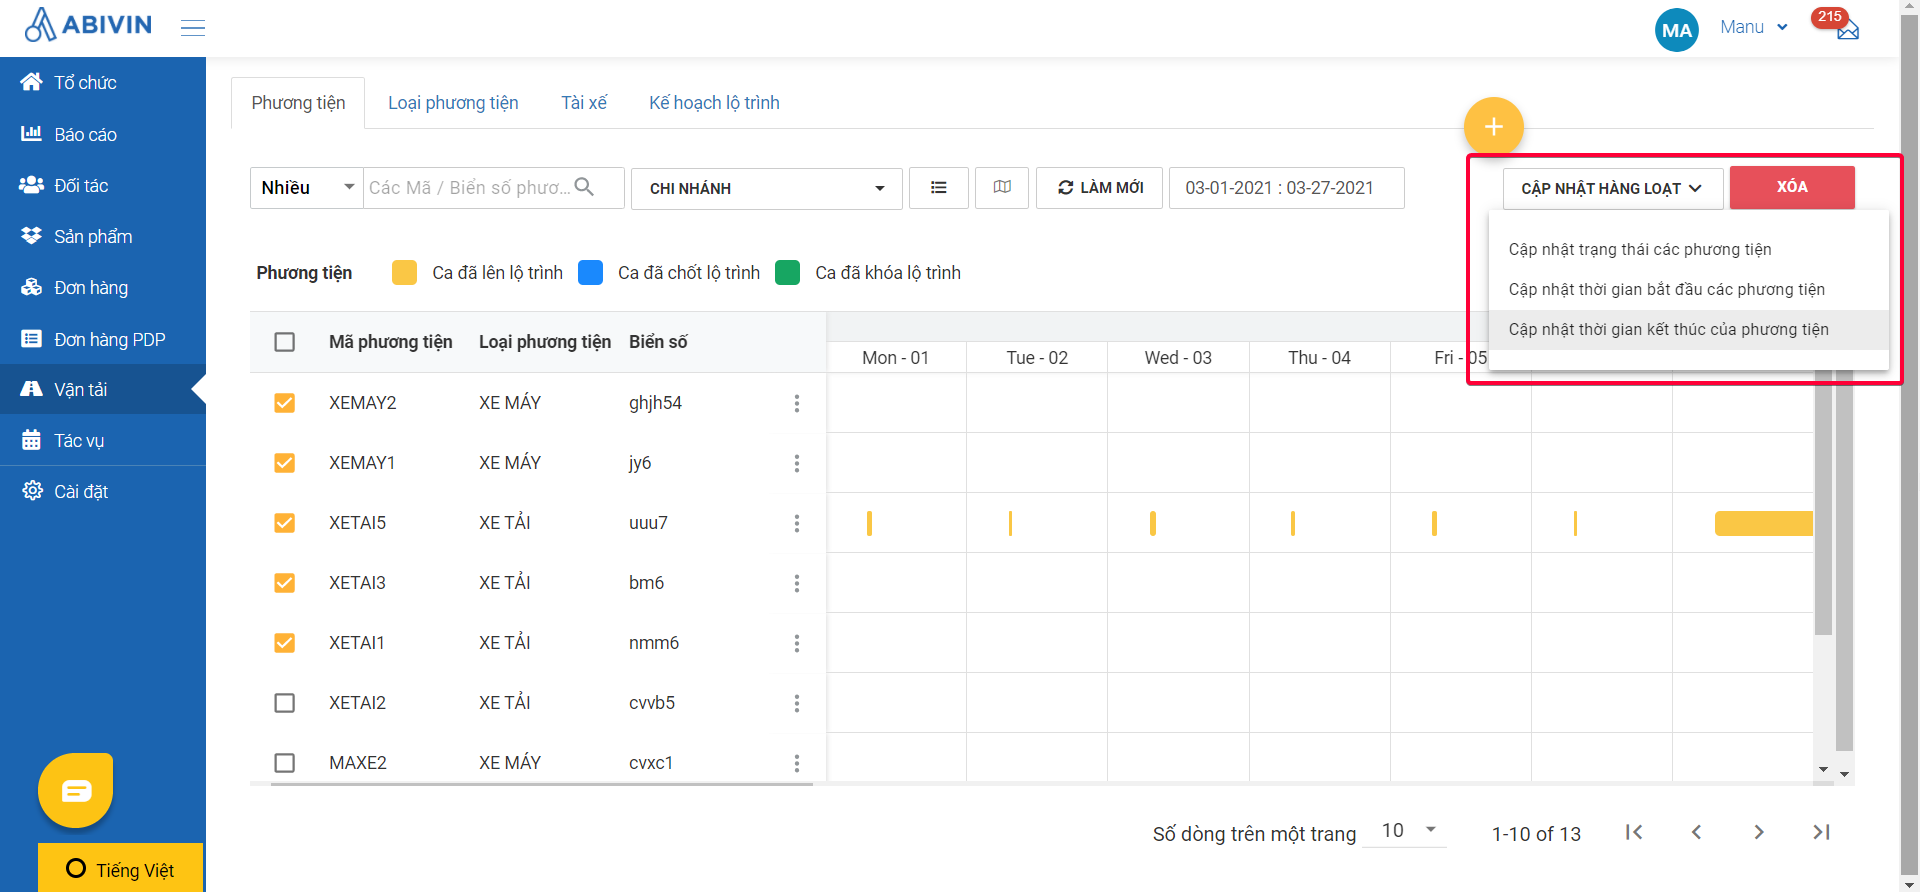
Illustration (Vietnamese)
- Edit Vehicle; Show Vehicle history panel; Delete Vehicle. These three functions are grouped into the three vertical dots icon at the right end of the Vehicle row on the table.
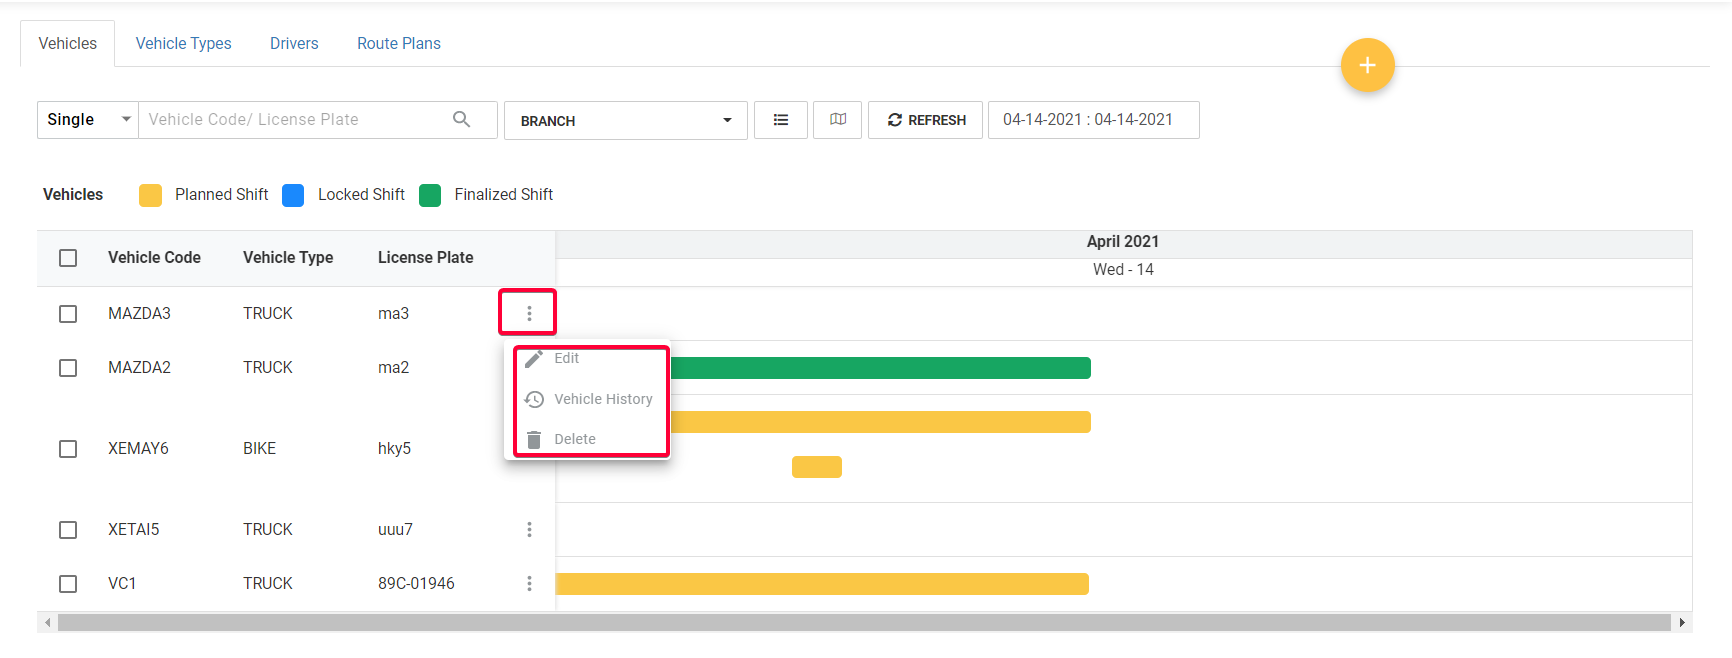
Illustration (English)
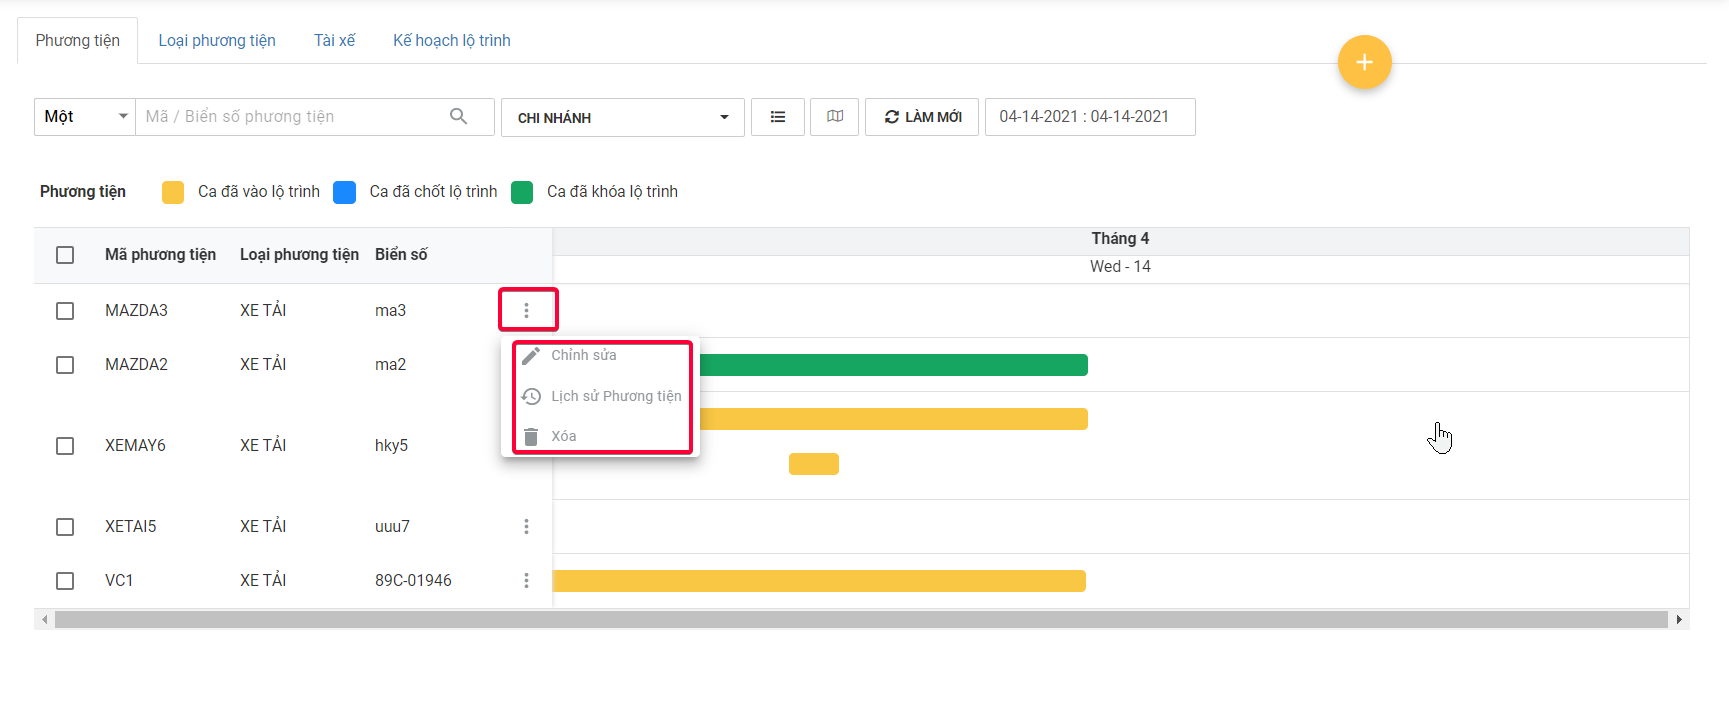
Illustration (Vietnamese)
Vehicle Usage History Gantt Chart
- The Gantt chart will visually depict the usage history of the Vehicles during a certain date range
- By default, the Gantt chart will only show the current date. To select another date range, please click on the date field on the toolbar then select an appropriate date range (Note: You cannot select more than 30 days).
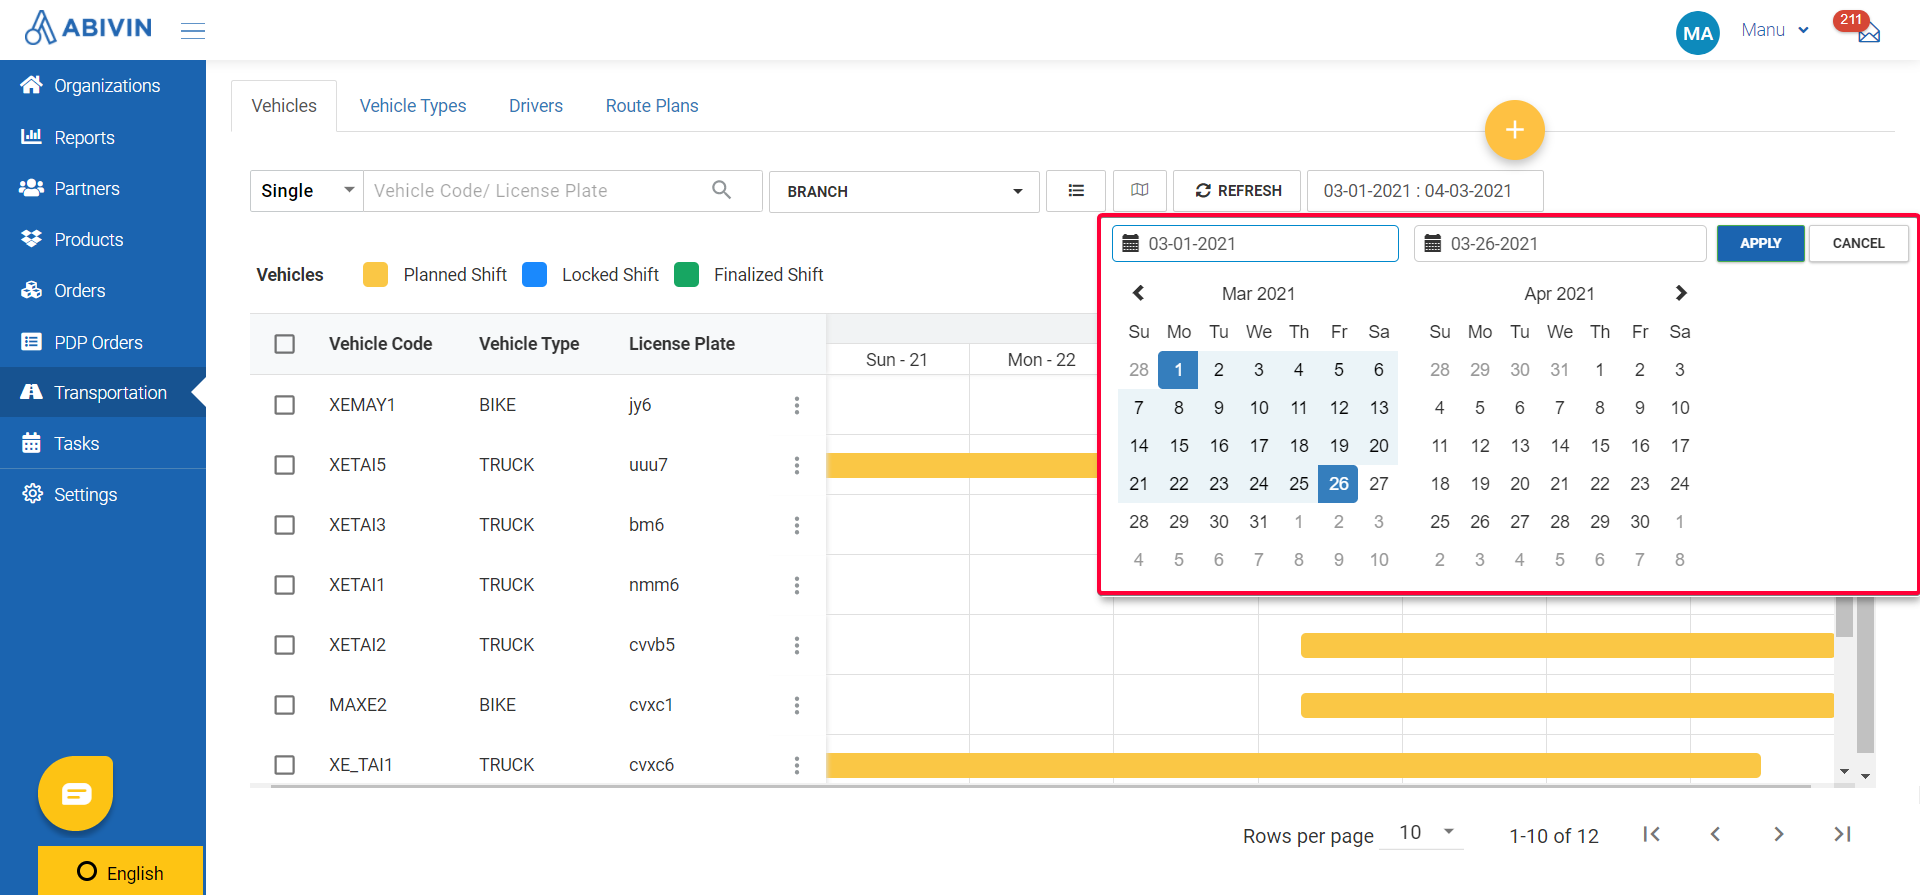
Illustration (English)
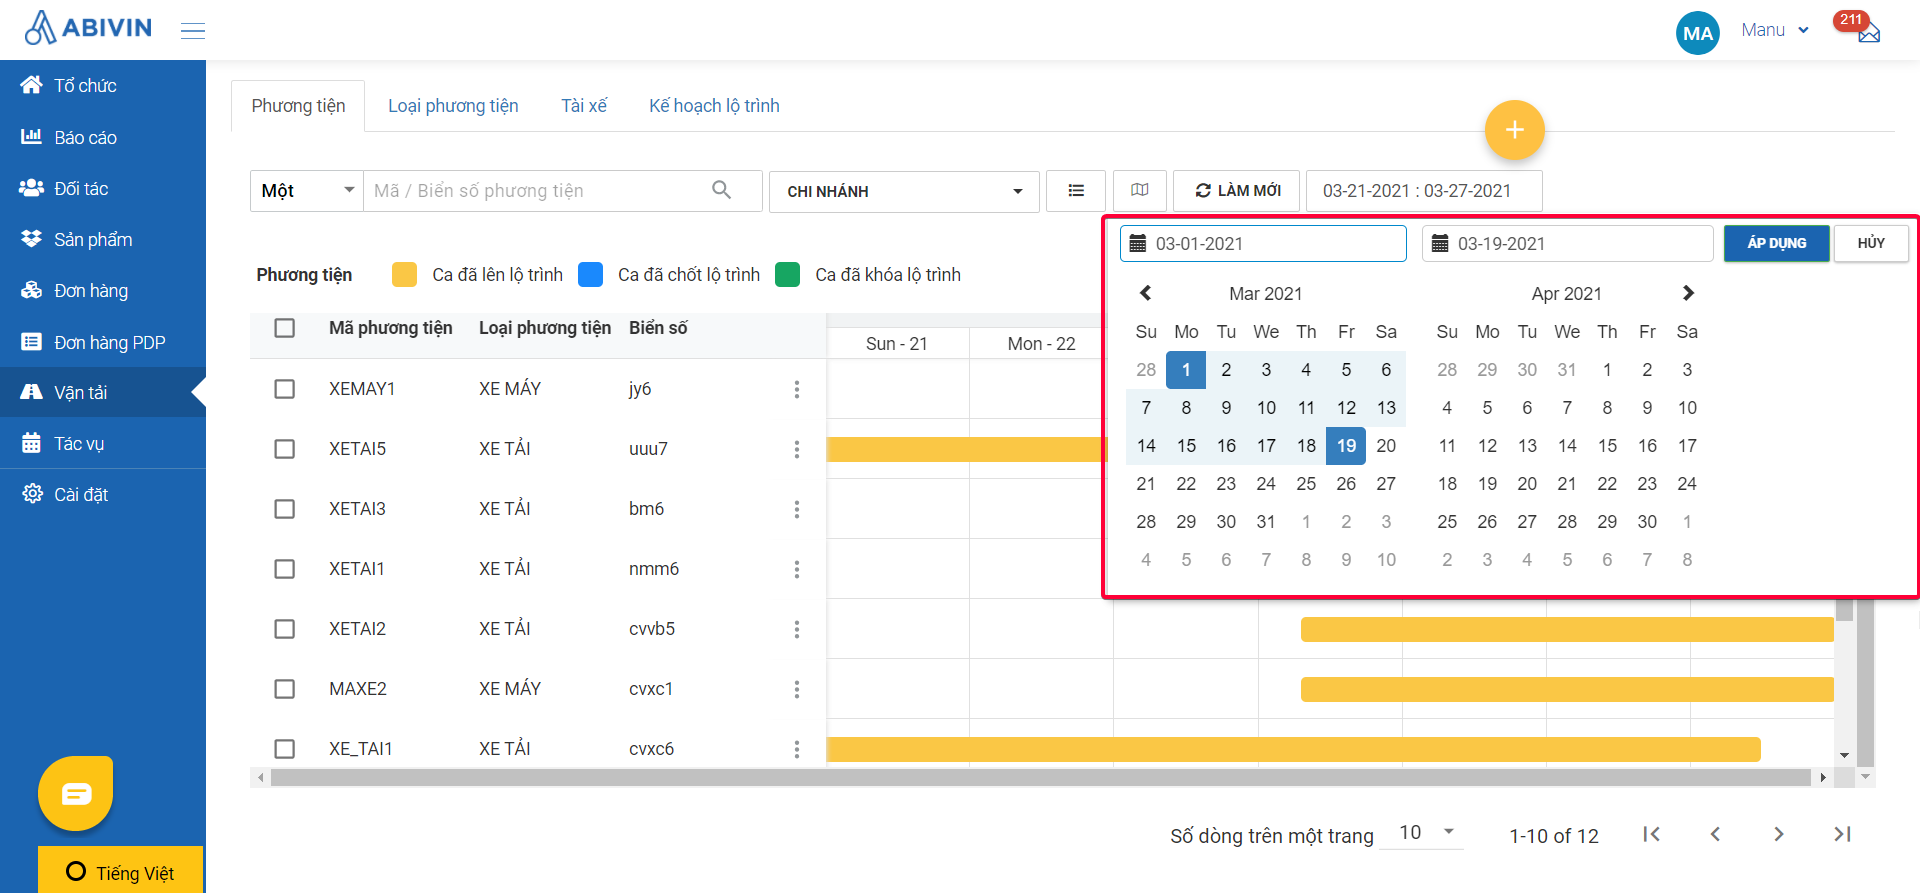
Illustration (Vietnamese)
- The length and the height of the Gantt chart might exceed the length and height of your screen. If that happens, you can use the horizontal and vertical scrollbar
- If during the selected date range, the Vehicles are used in the Route Plans, then their Delivery Shifts will appear in the chart in the form of the horizontal colored bars. The colors of the bar are explained in the Vehicle Planning Status Bar section.
- The length of the bar equals the length of the corresponding Delivery Shift on the Plan Timeline panel (Not the Execution Timeline panel) The beginning and the end of the bar mark the beginning and the end timestamps of the Delivery Shift.
- When you hover the mouse onto a bar, you will see the following information of the Delivery Shift:
- 1 - Its Code on the Route Plan.
- 2 - Its current Planning Status.
- 3 - Its Start Time and Stop Time as planned by the system.
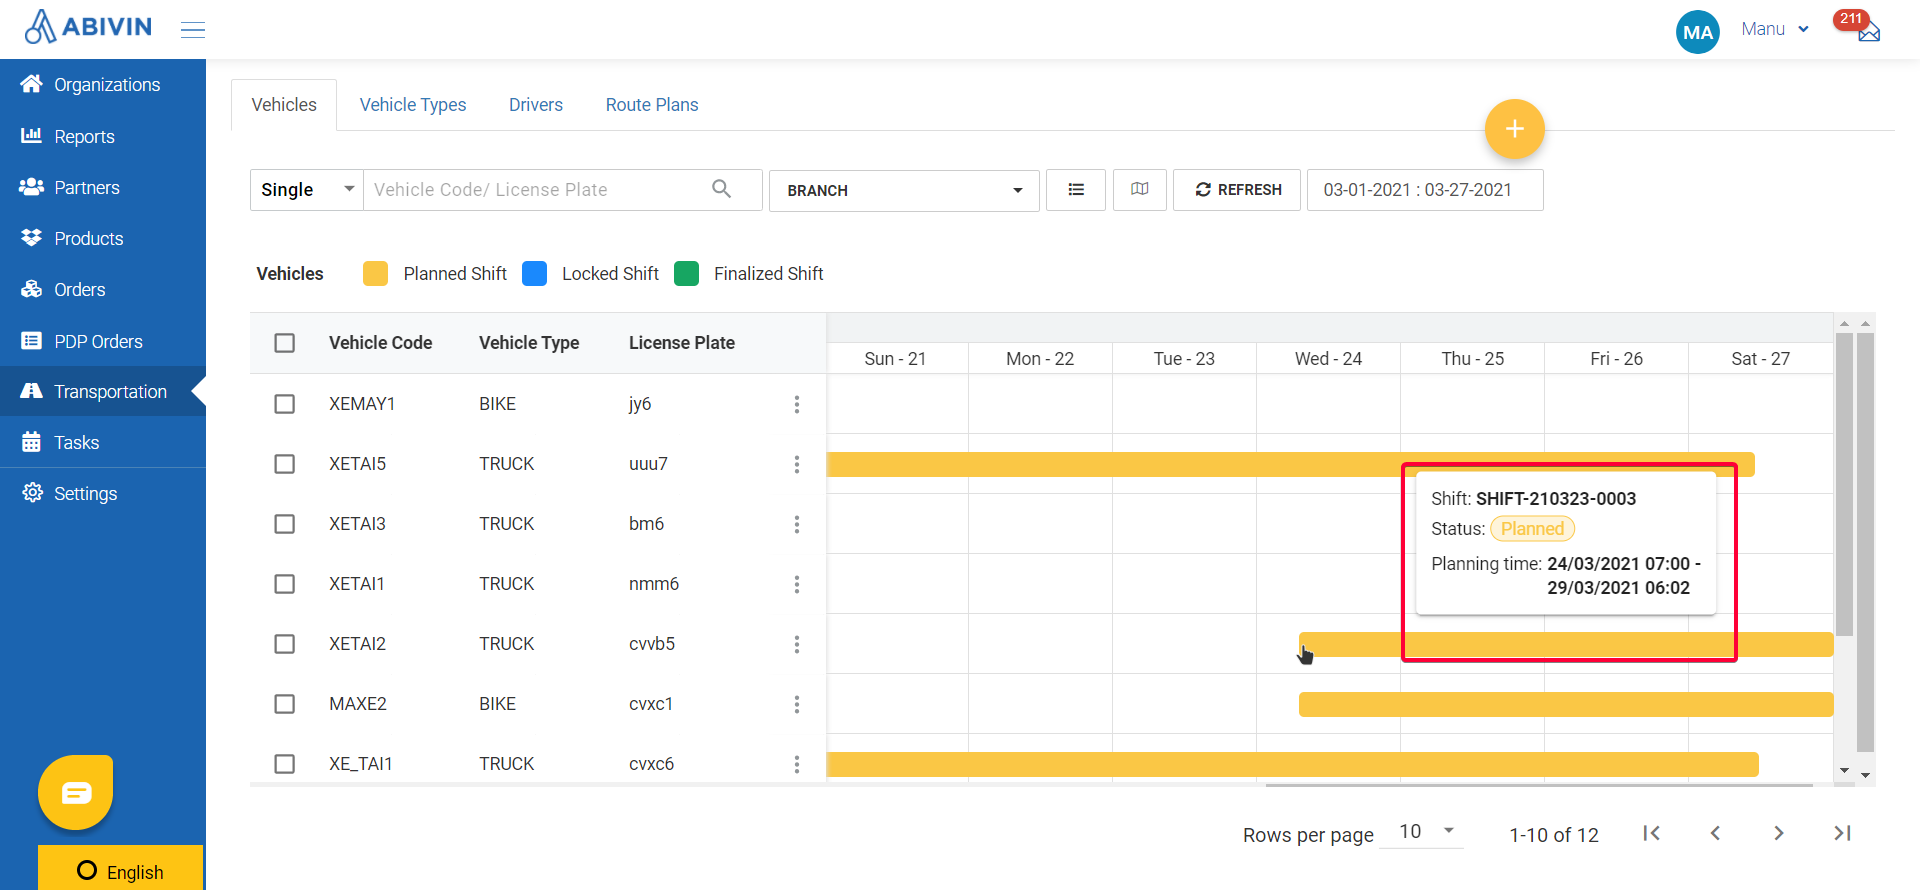
Illustration (English)
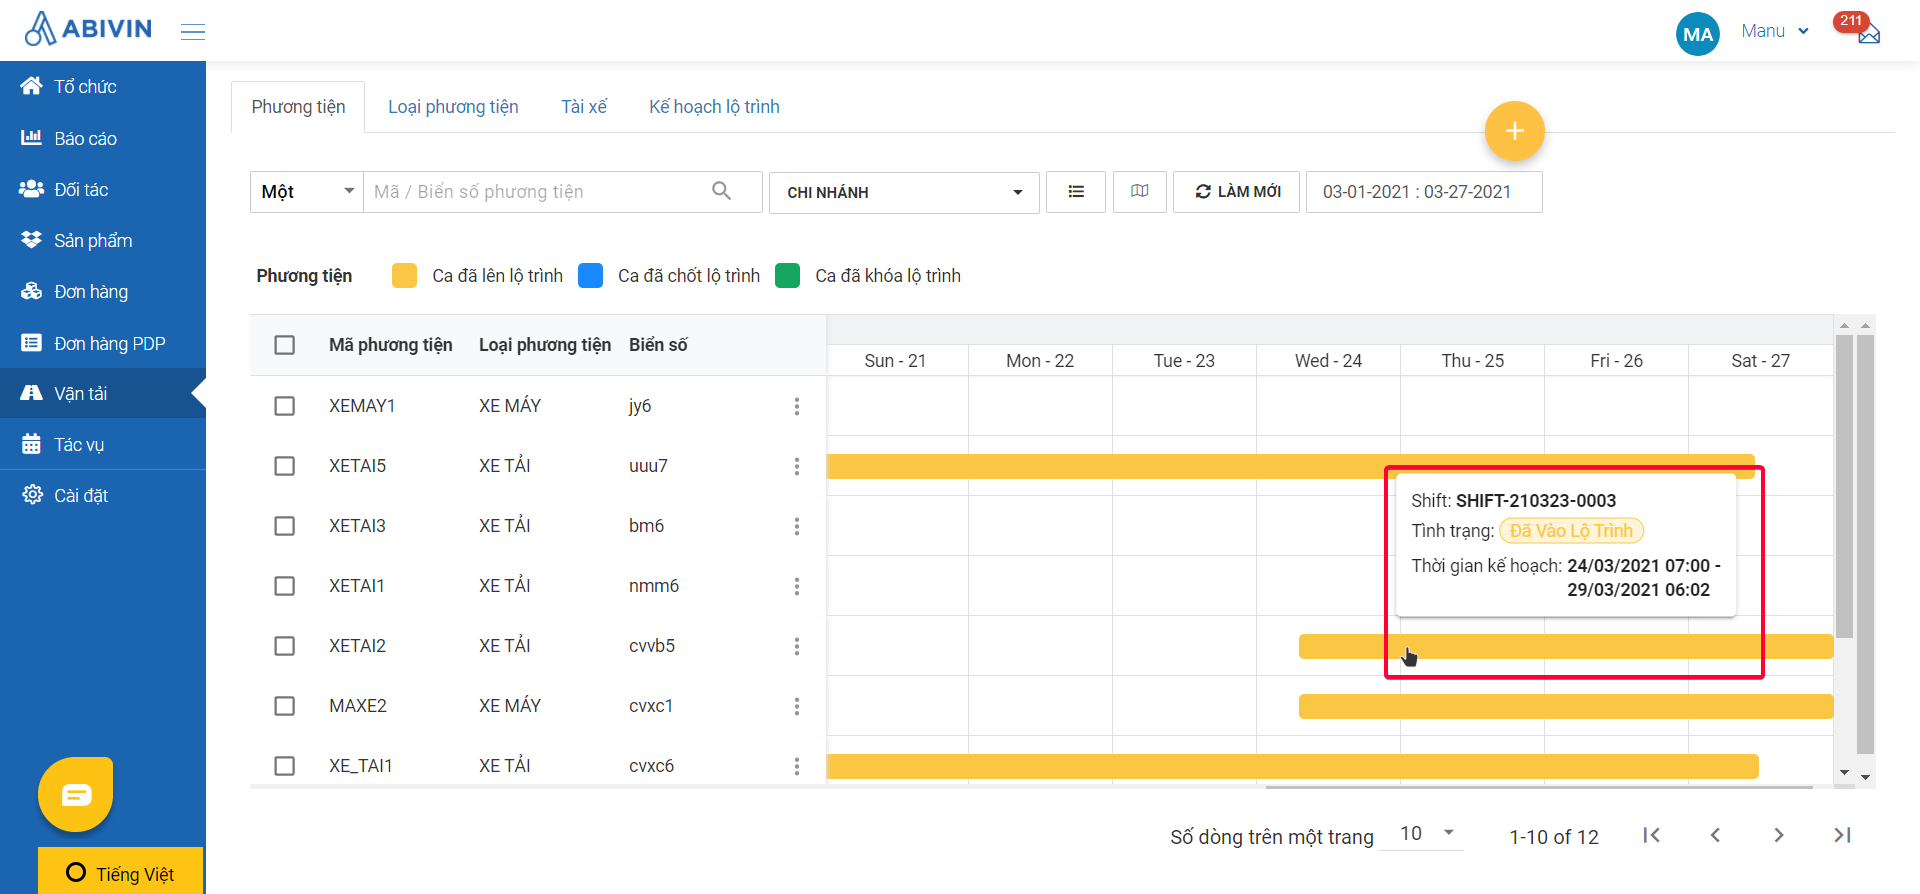
Illustration (Vietnamese)
- One Vehicle can have multiple horizontal bars on the Gantt chart. This means the Vehicle is assigned multiple Delivery Shifts.
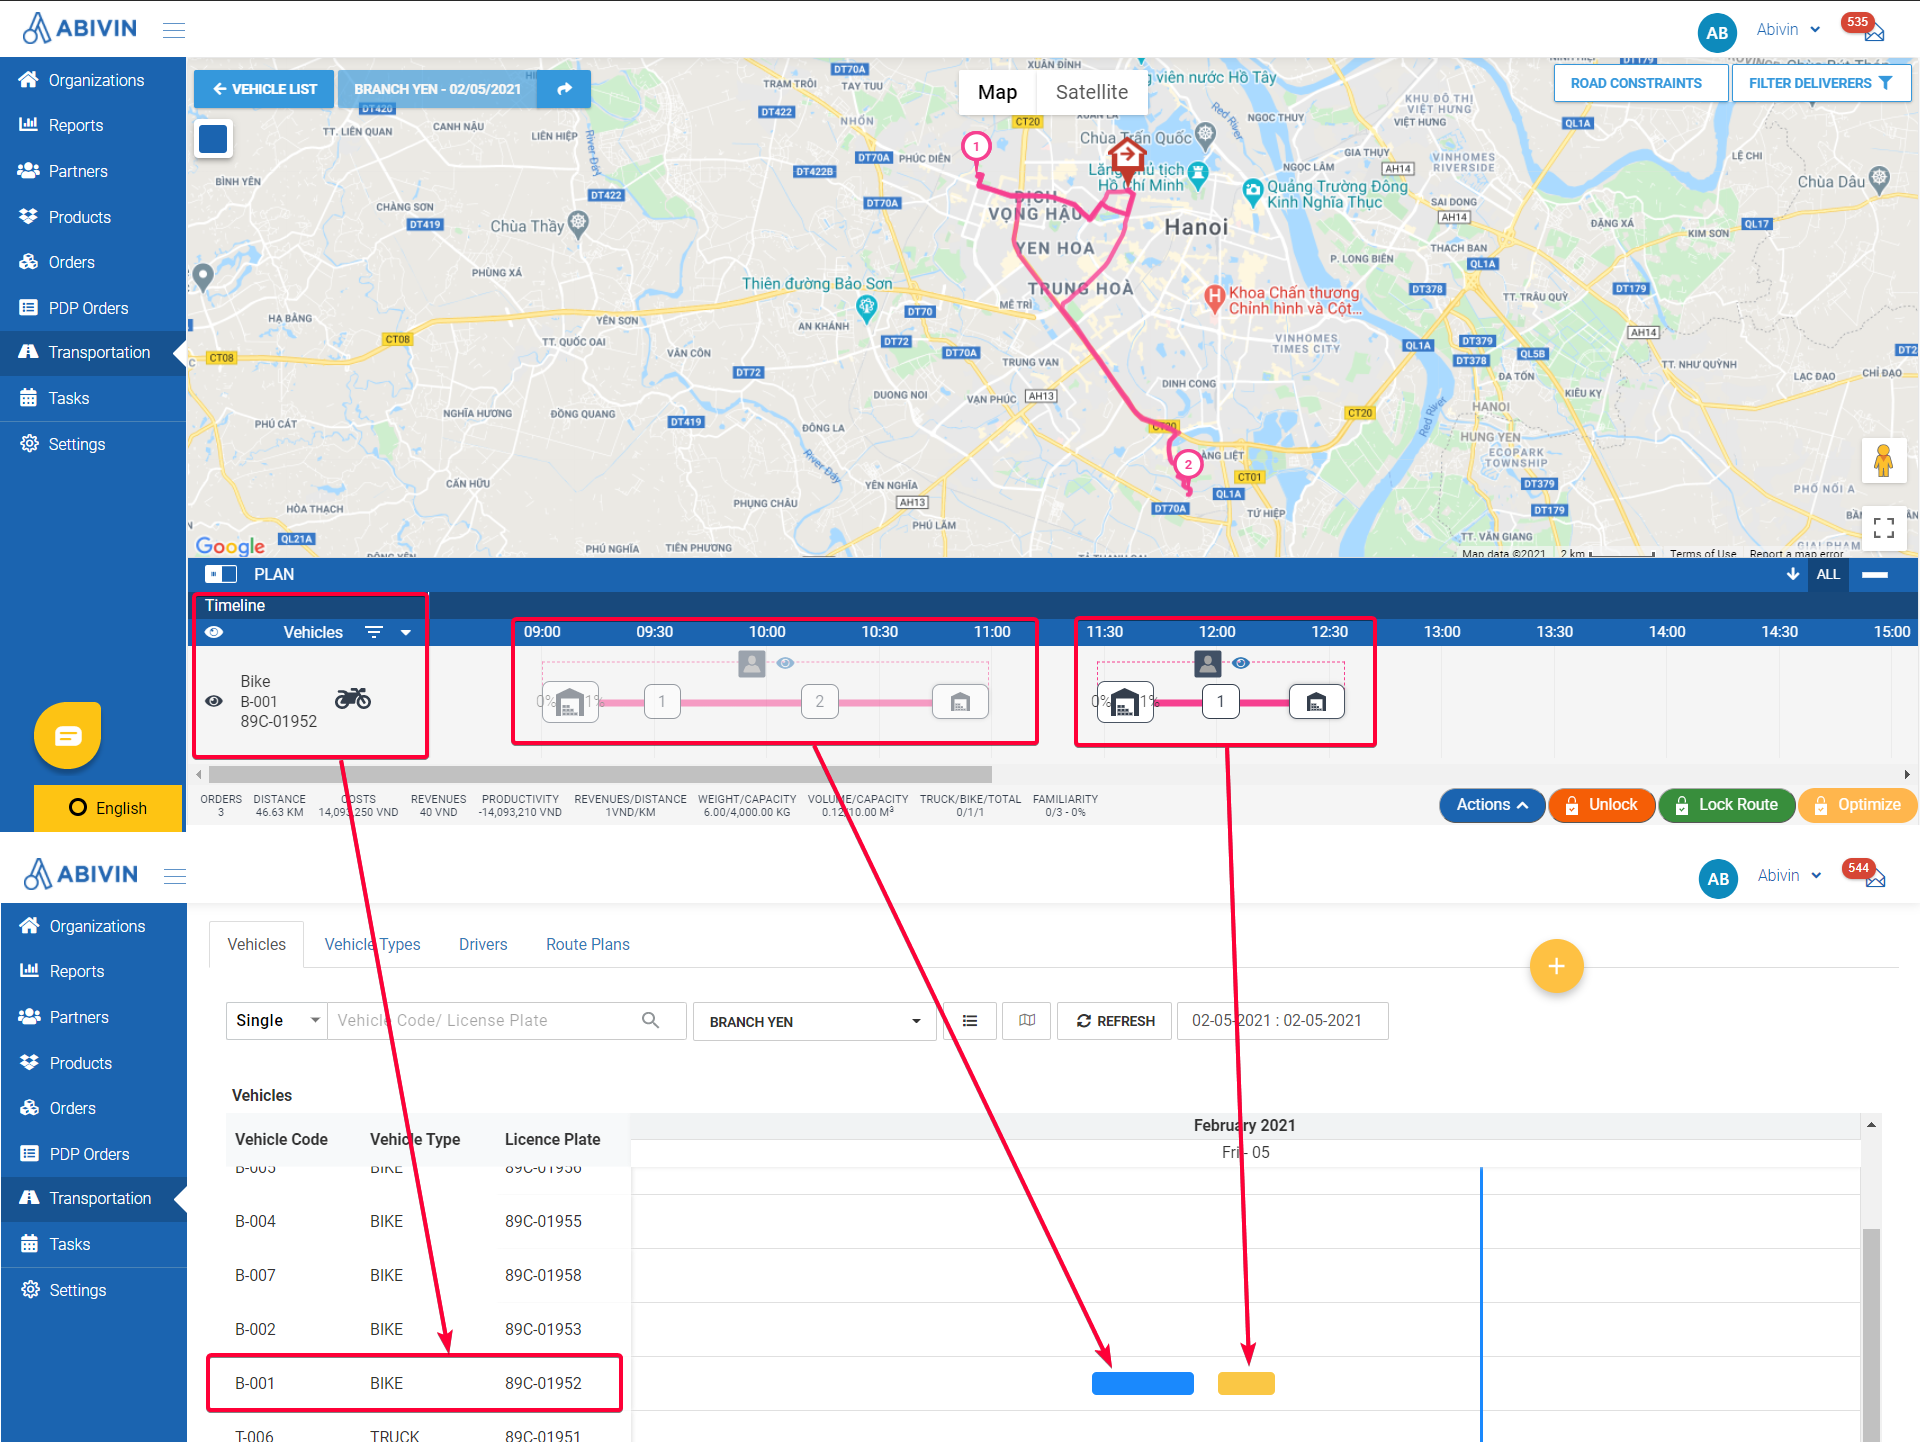
Illustration (English)
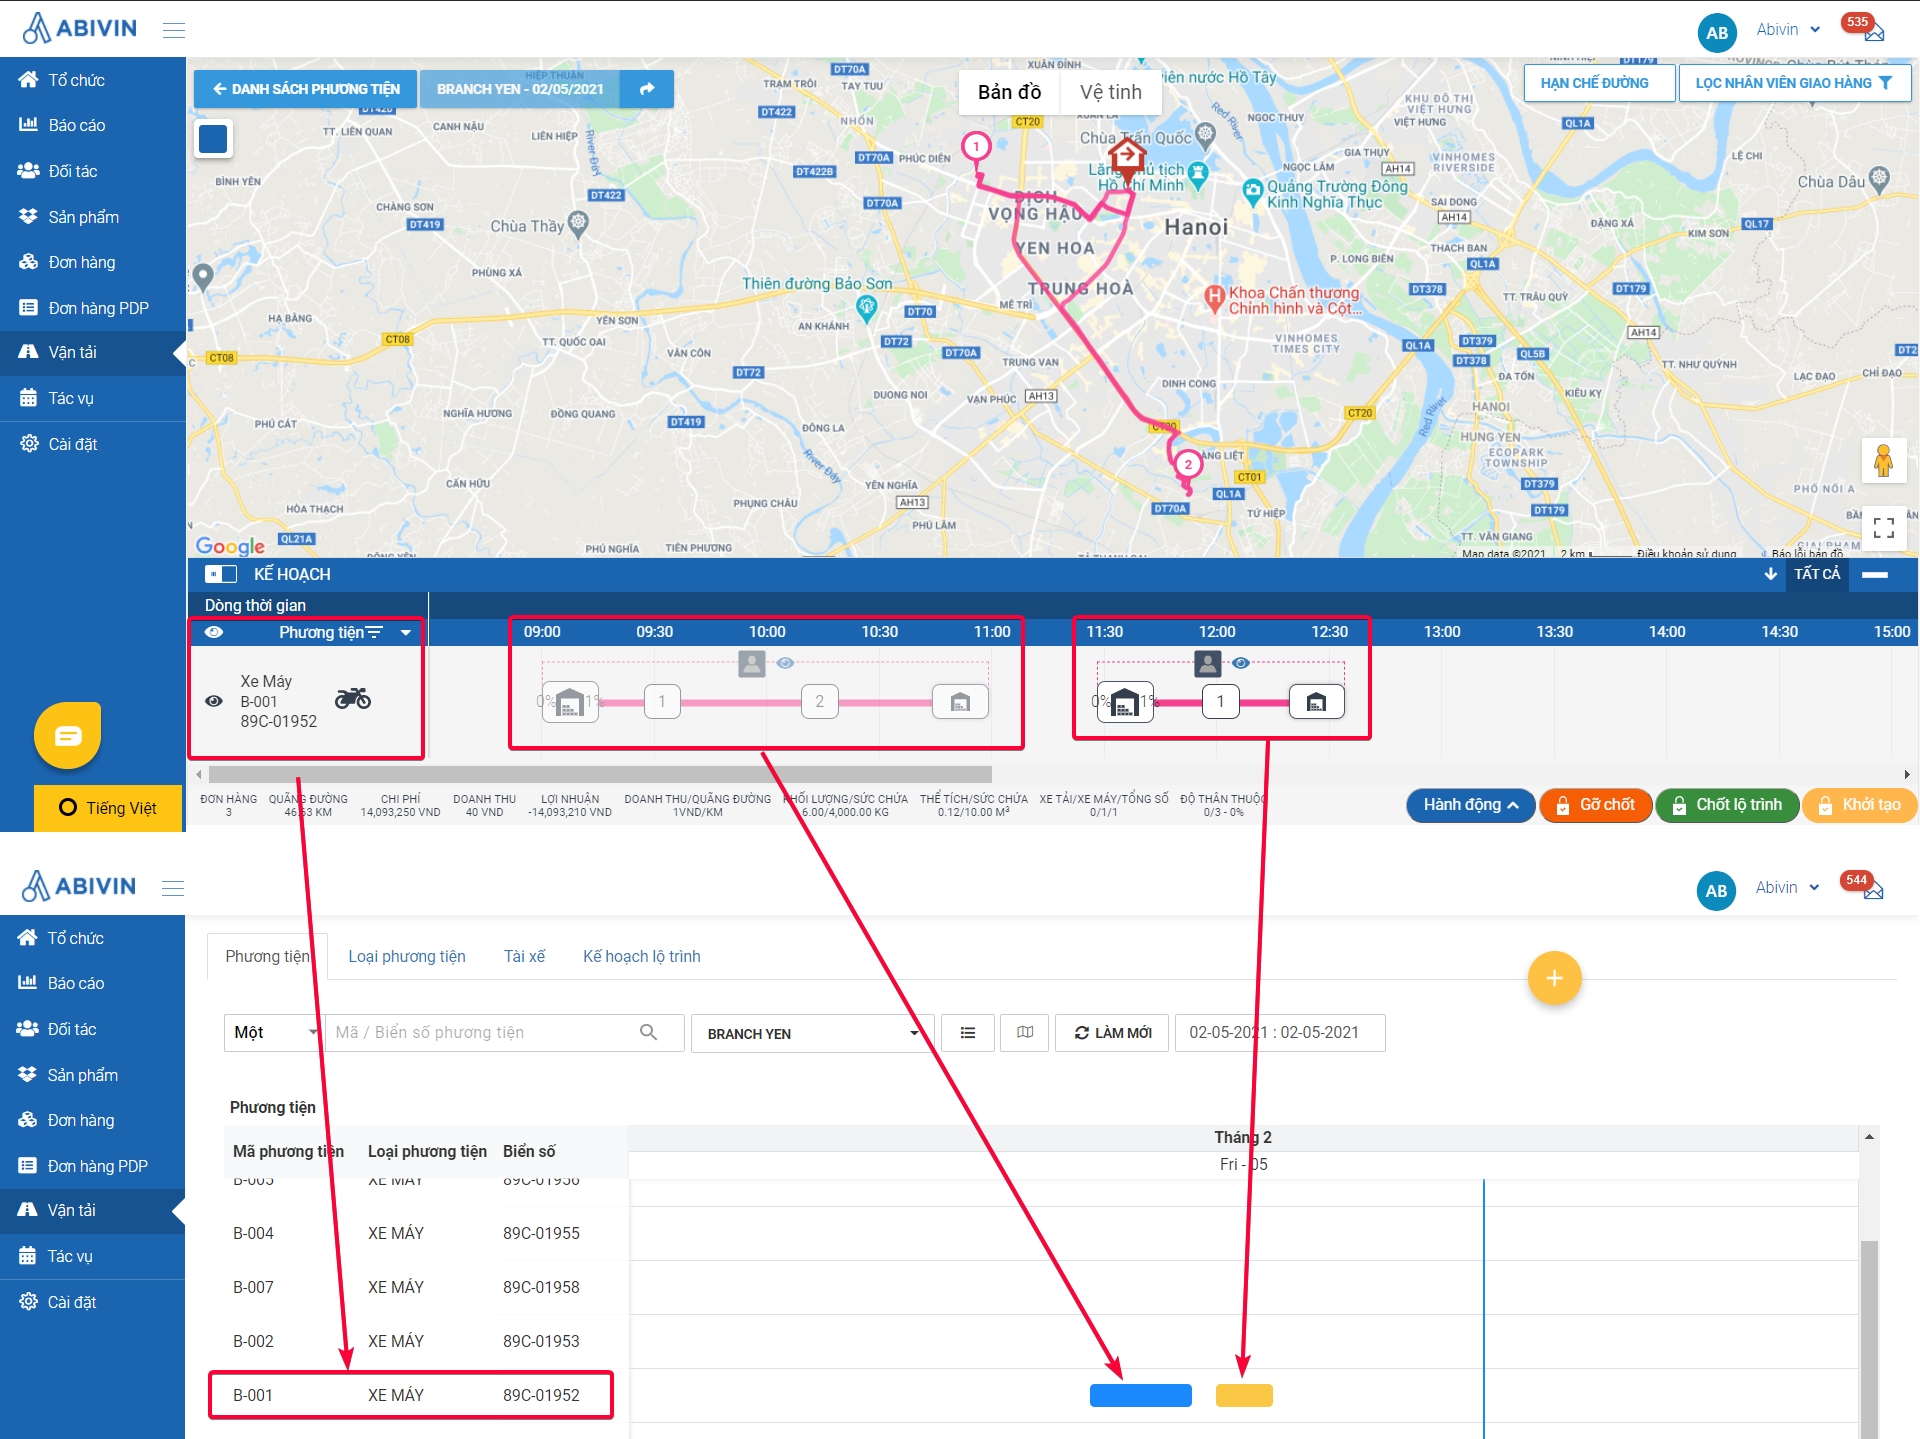
Illustration (Vietnamese)
- If you click on a horizontal bar, you will be directed to the Map View Screen of the Route Plan that stores the corresponding Delivery Shift.
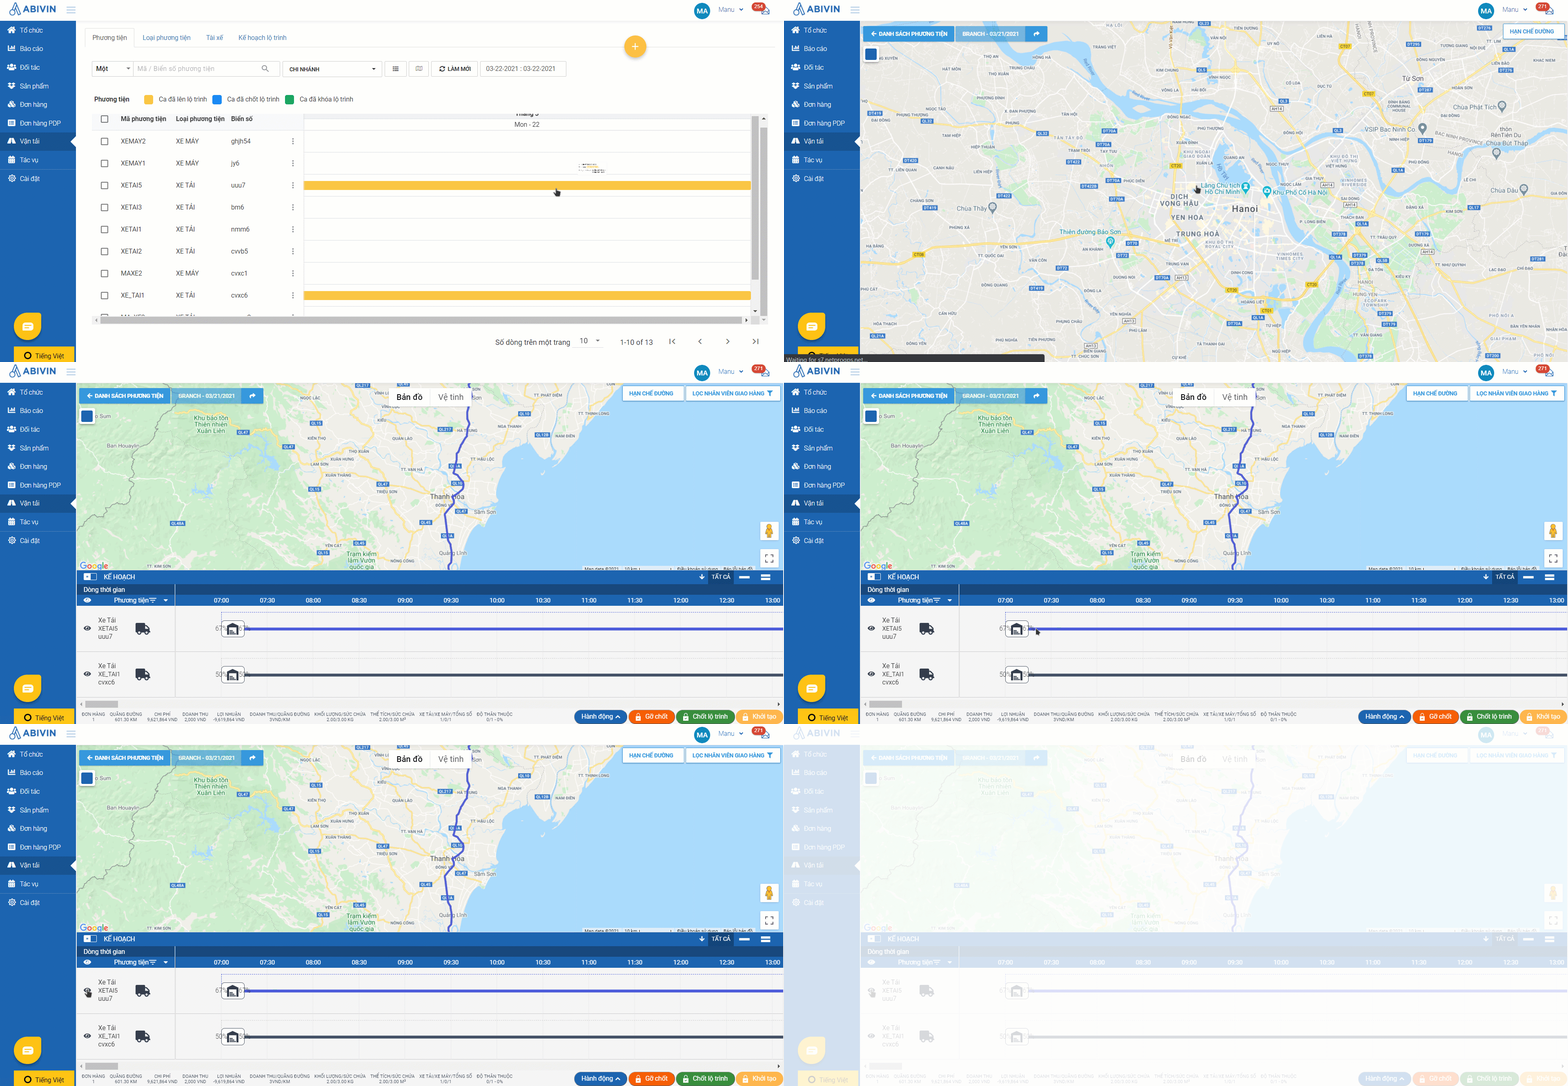
Illustration (English)
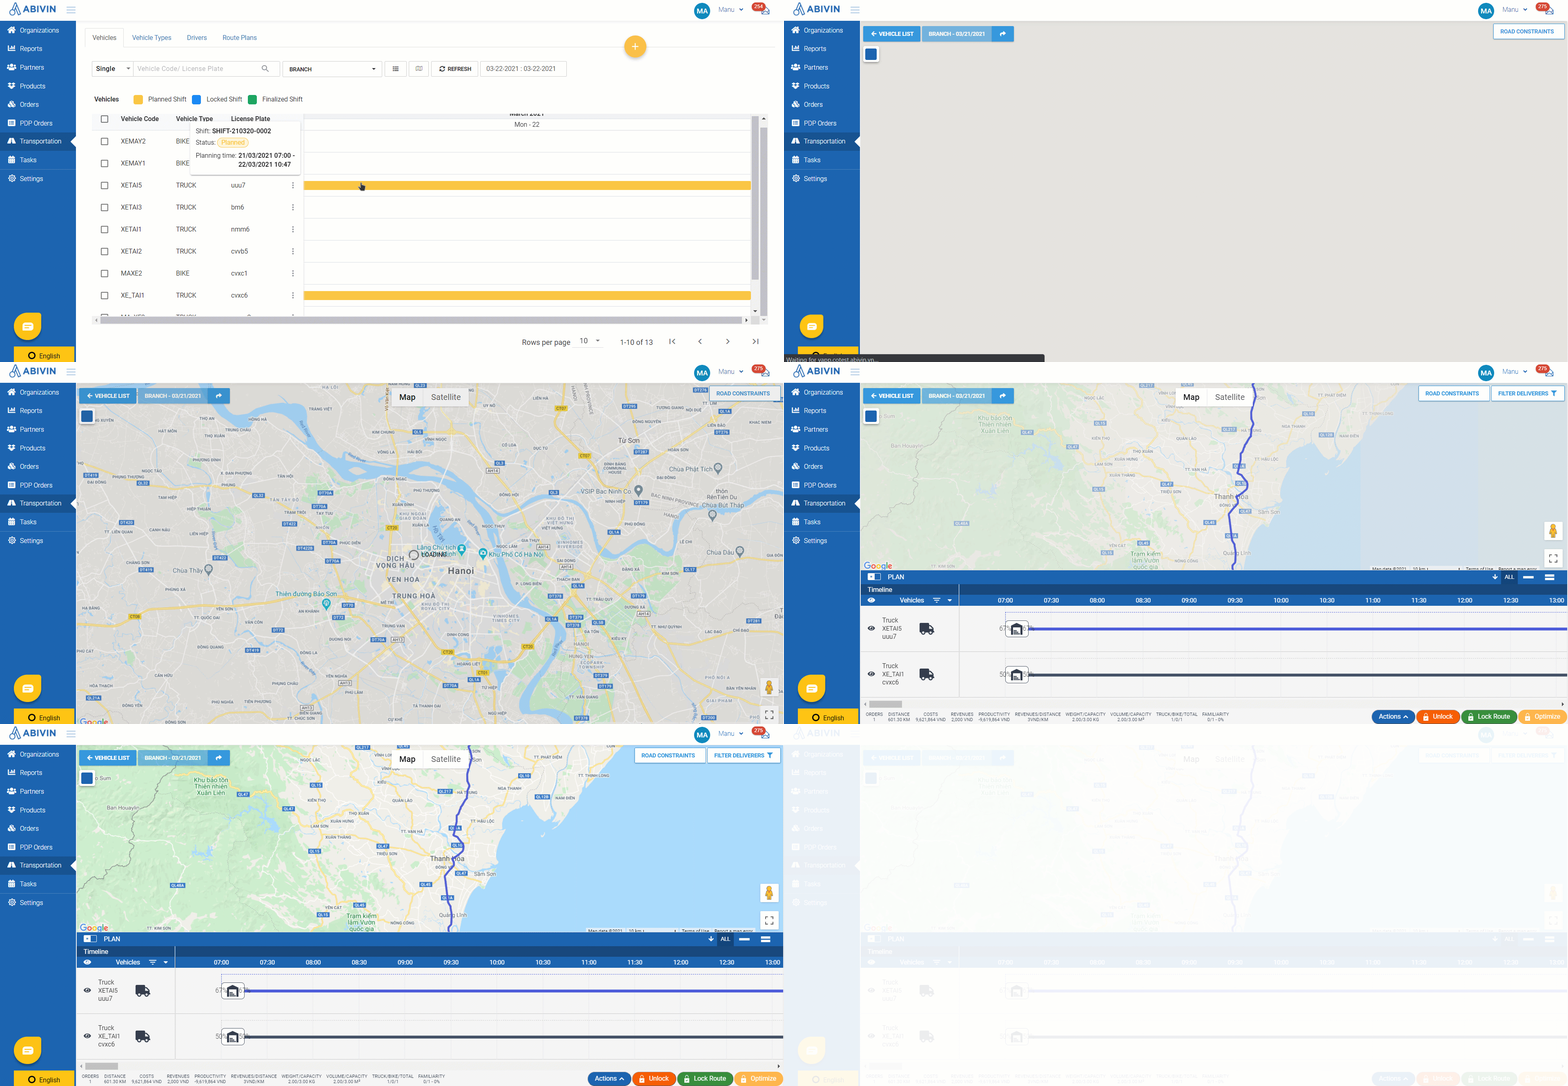
Illustration (Vietnamese)
- Everything you do to the Delivery Shift in the Route Plan screen will reflect on the Gantt chart, for example:
- You change the Planning Status of a Vehicle's Delivery Shift from Locked to Planned. The color and the Planning Status information of the Delivery Shift's corresponding horizontal bar on the Gantt chart will also change.
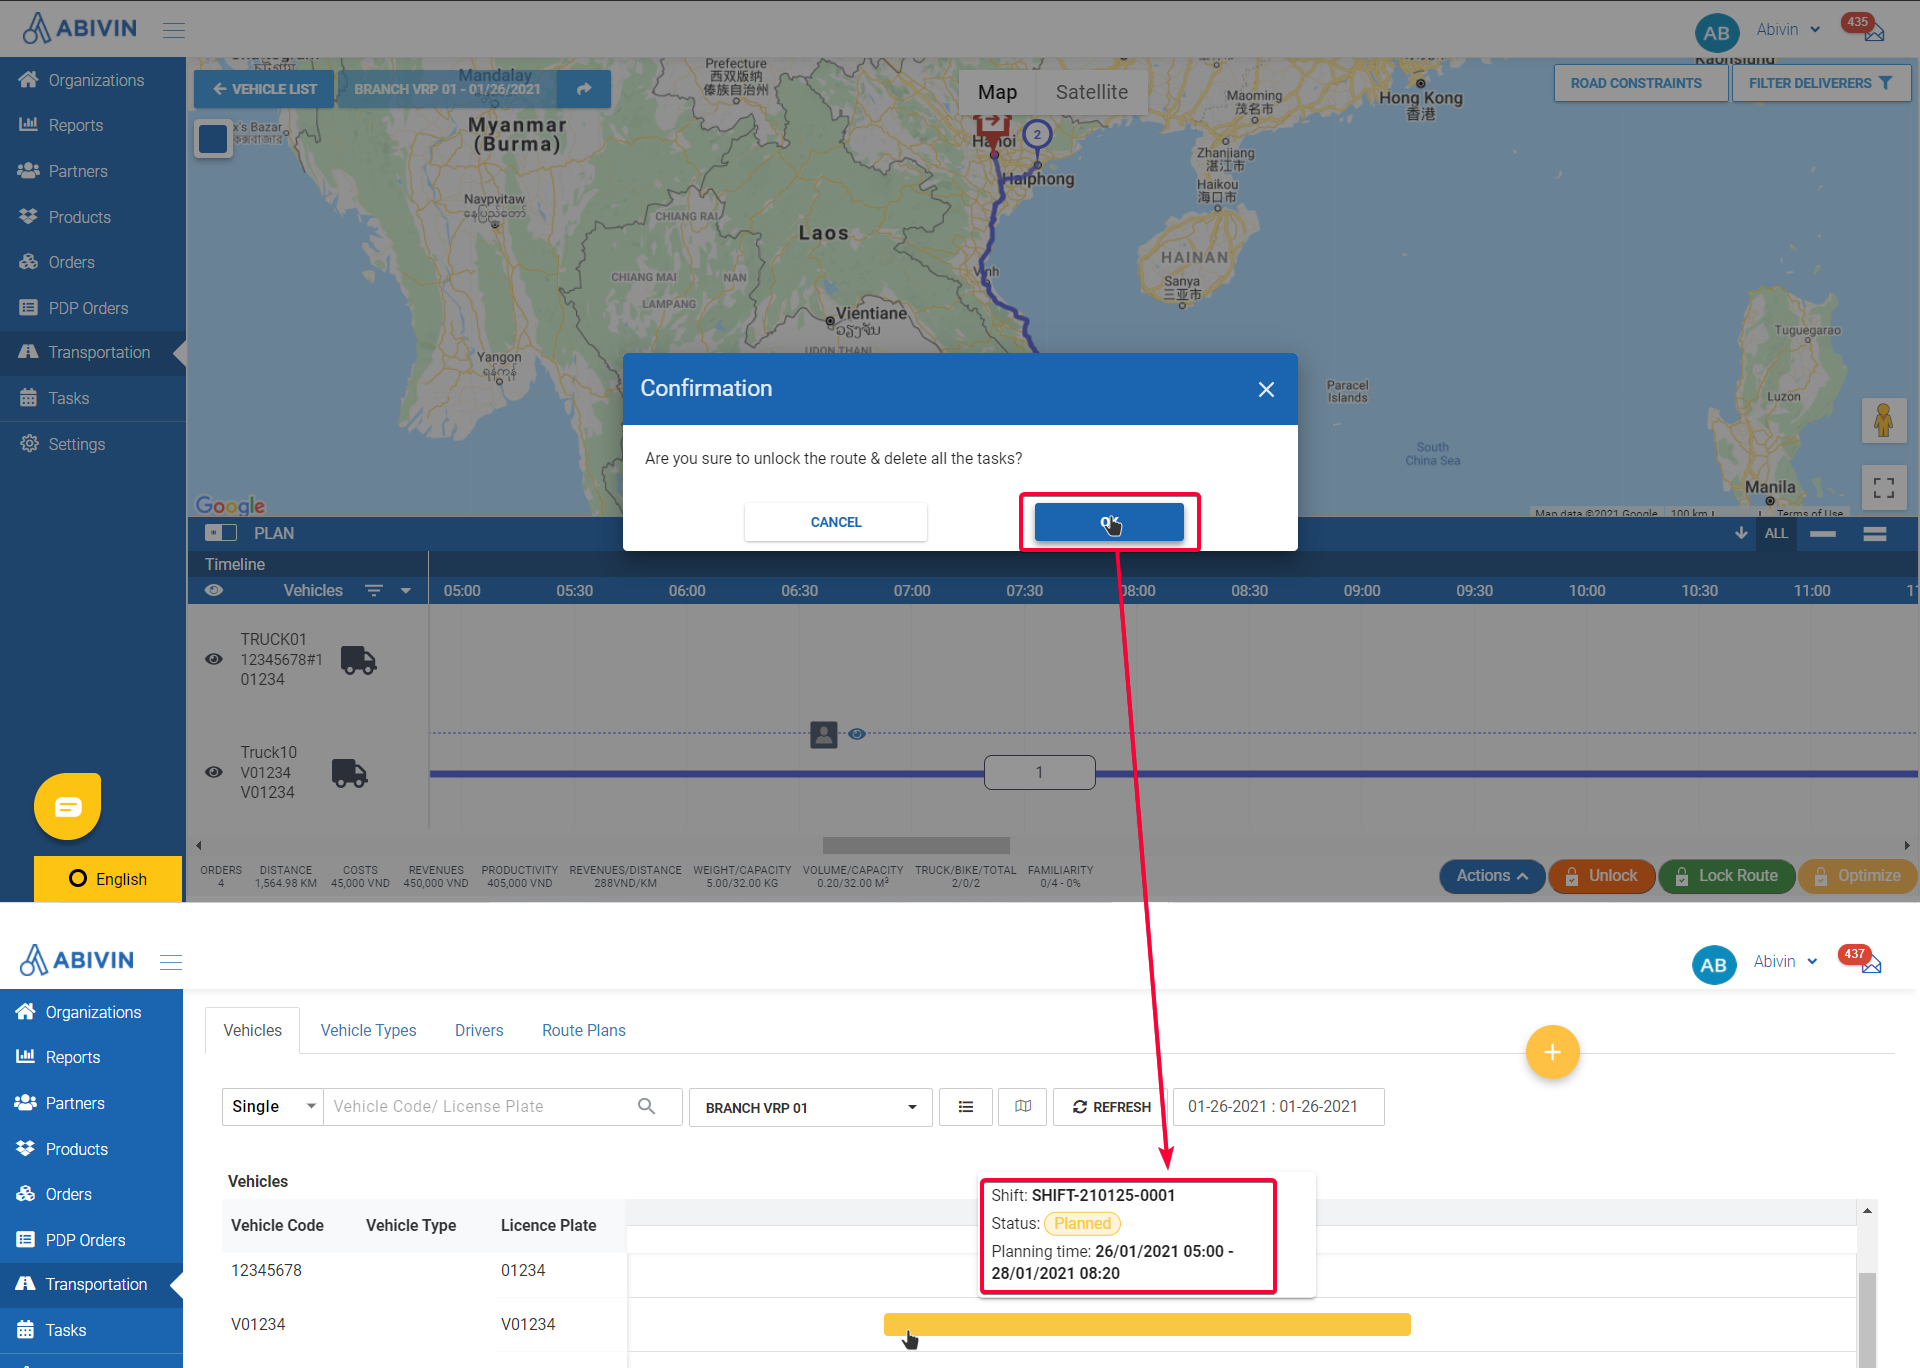
Illustration (English)
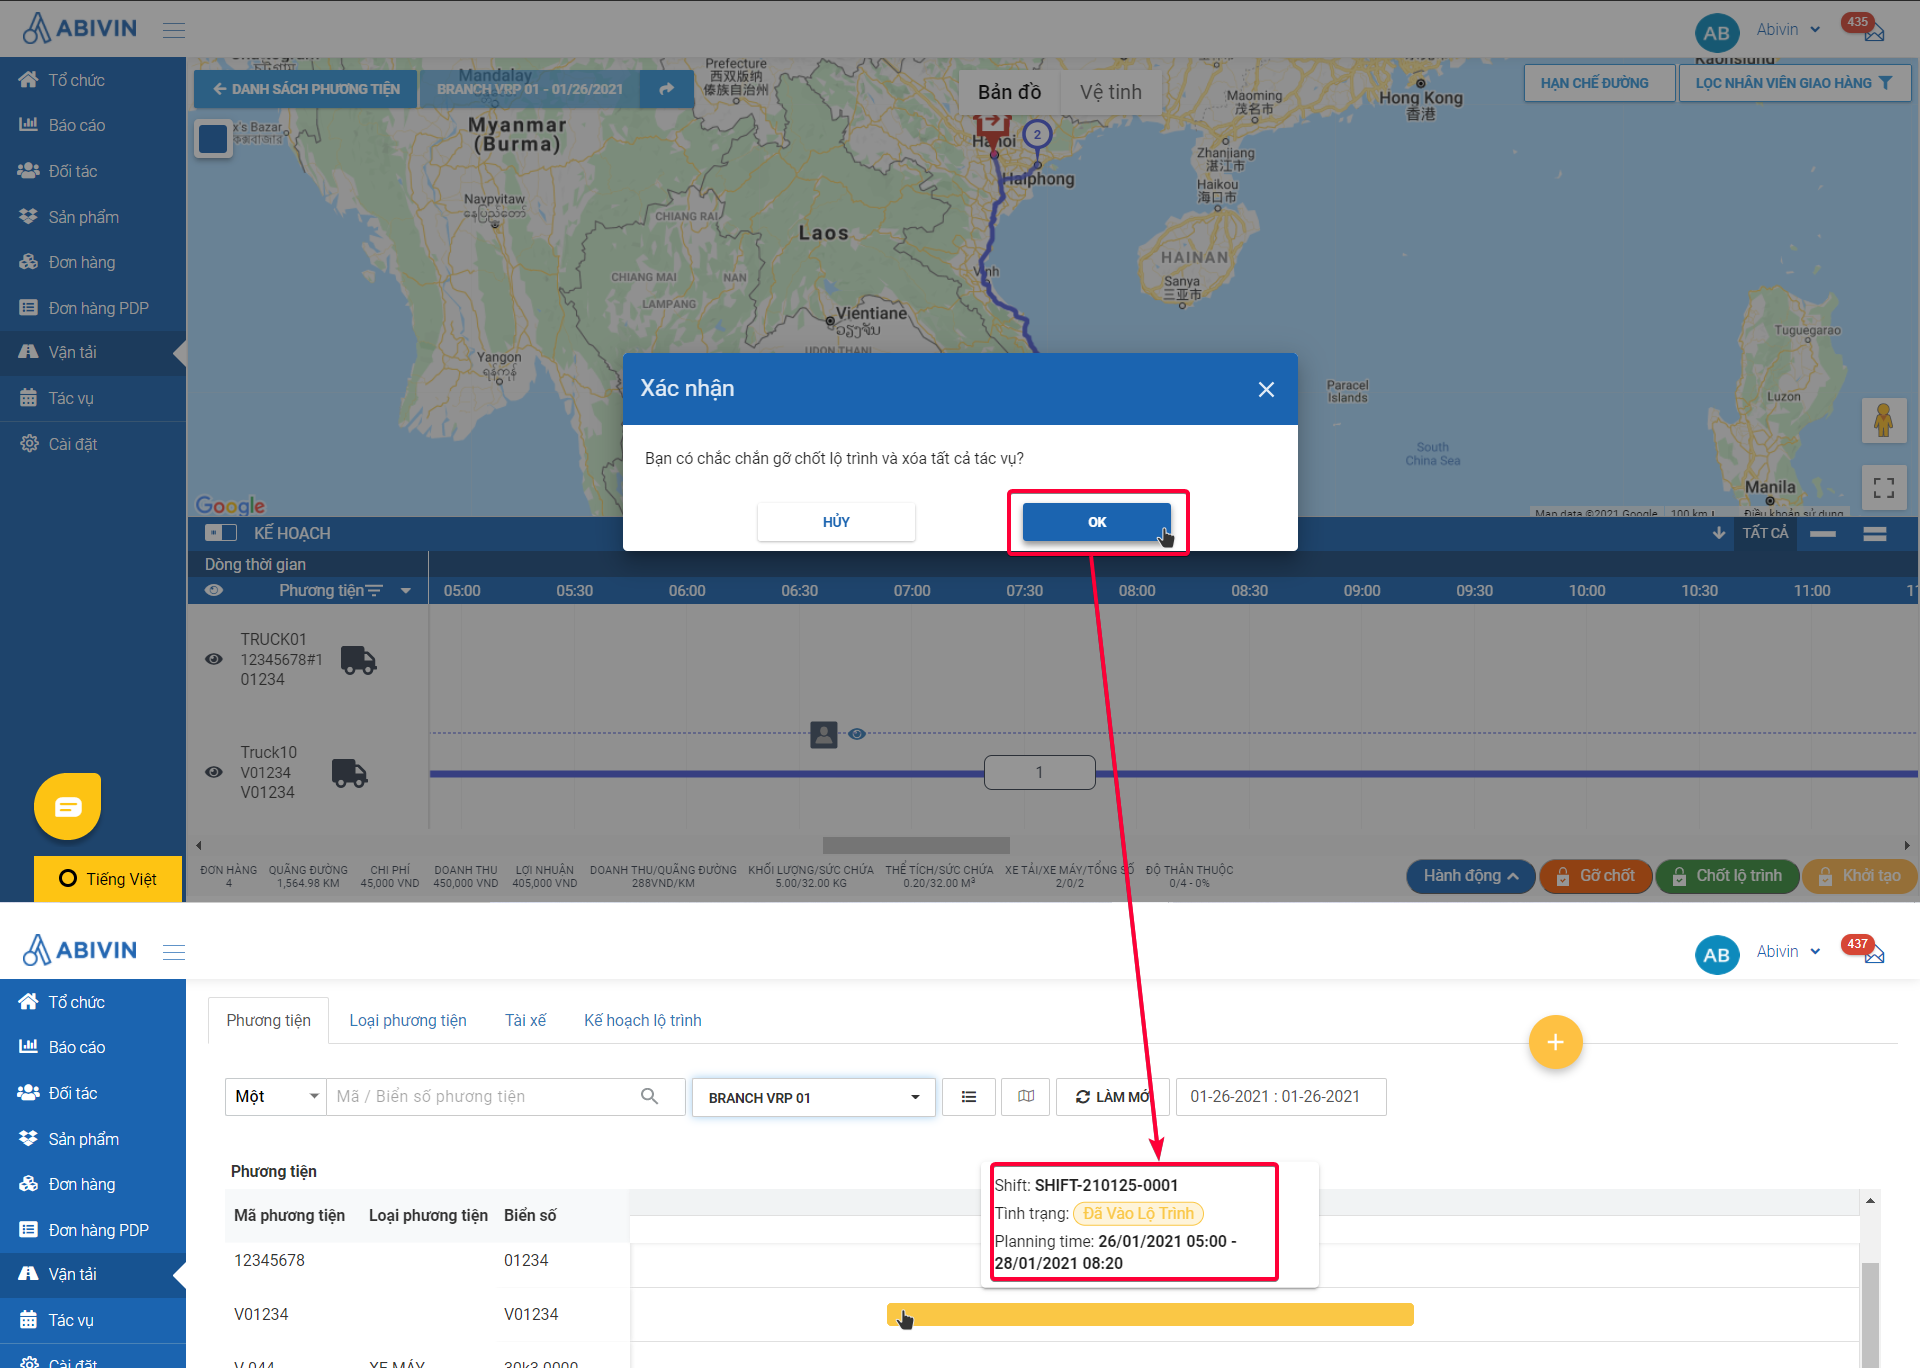
Illustration (Vietnamese)
- You assign the Delivery Shift from one Vehicle to another. The Delivery Shift's horizontal bar will move from the past Vehicle to the new one.
- If you use two browser tabs, one for the Route Plan and one for the Gantt View, you can click the Refresh button on the Gantt View toolbar to update the latest changes to the Delivery Shifts on the Gantt chart.
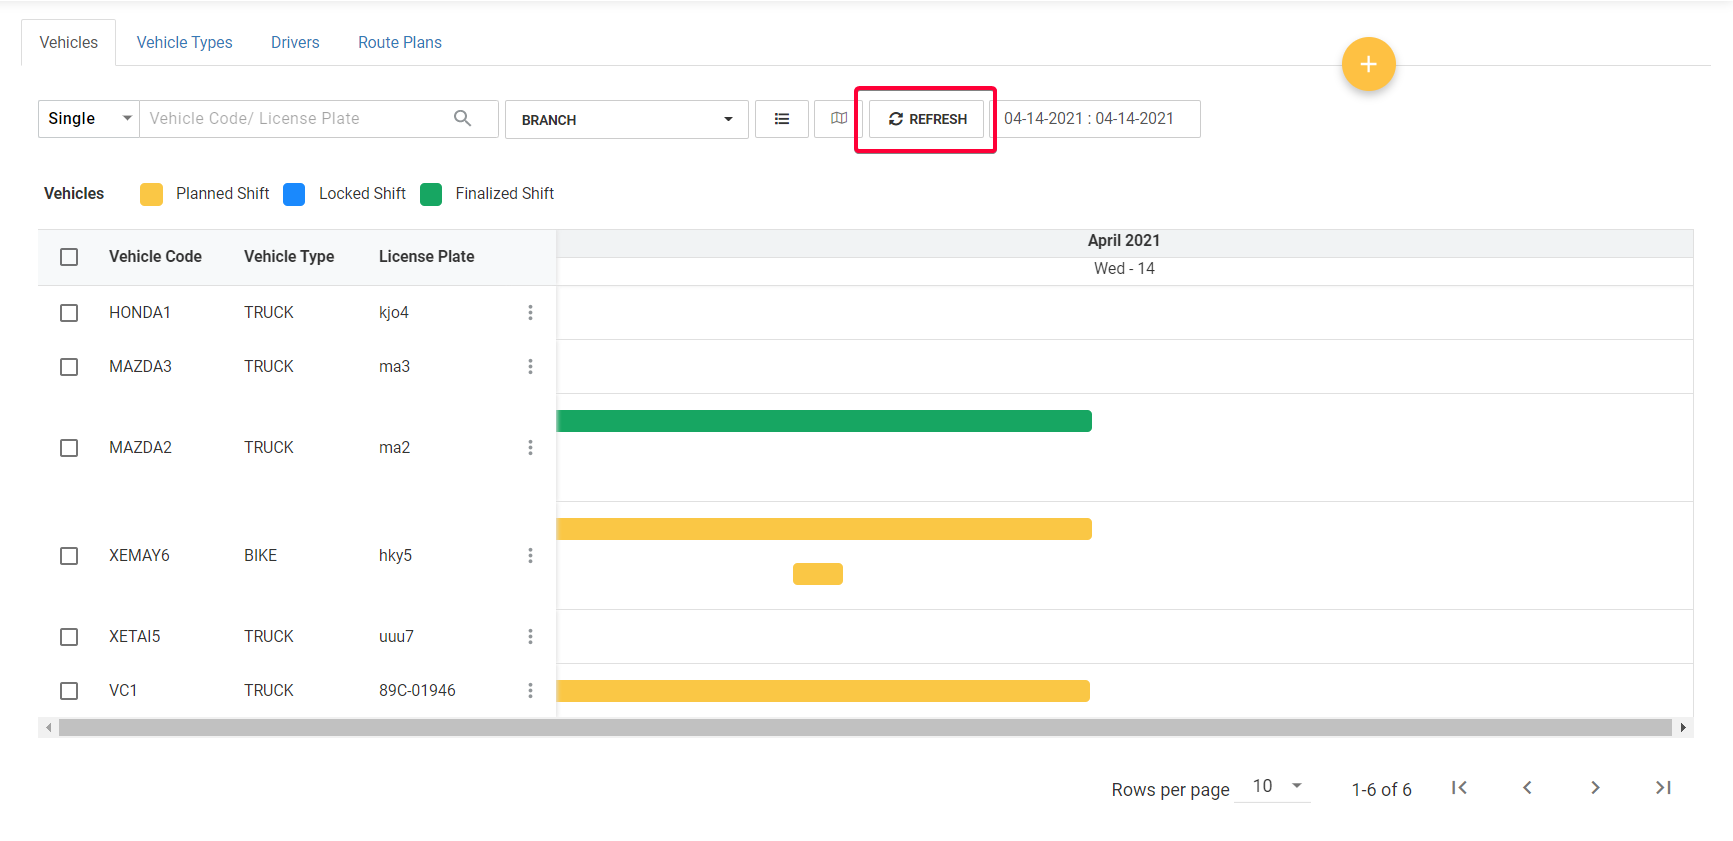
Illustration (English)
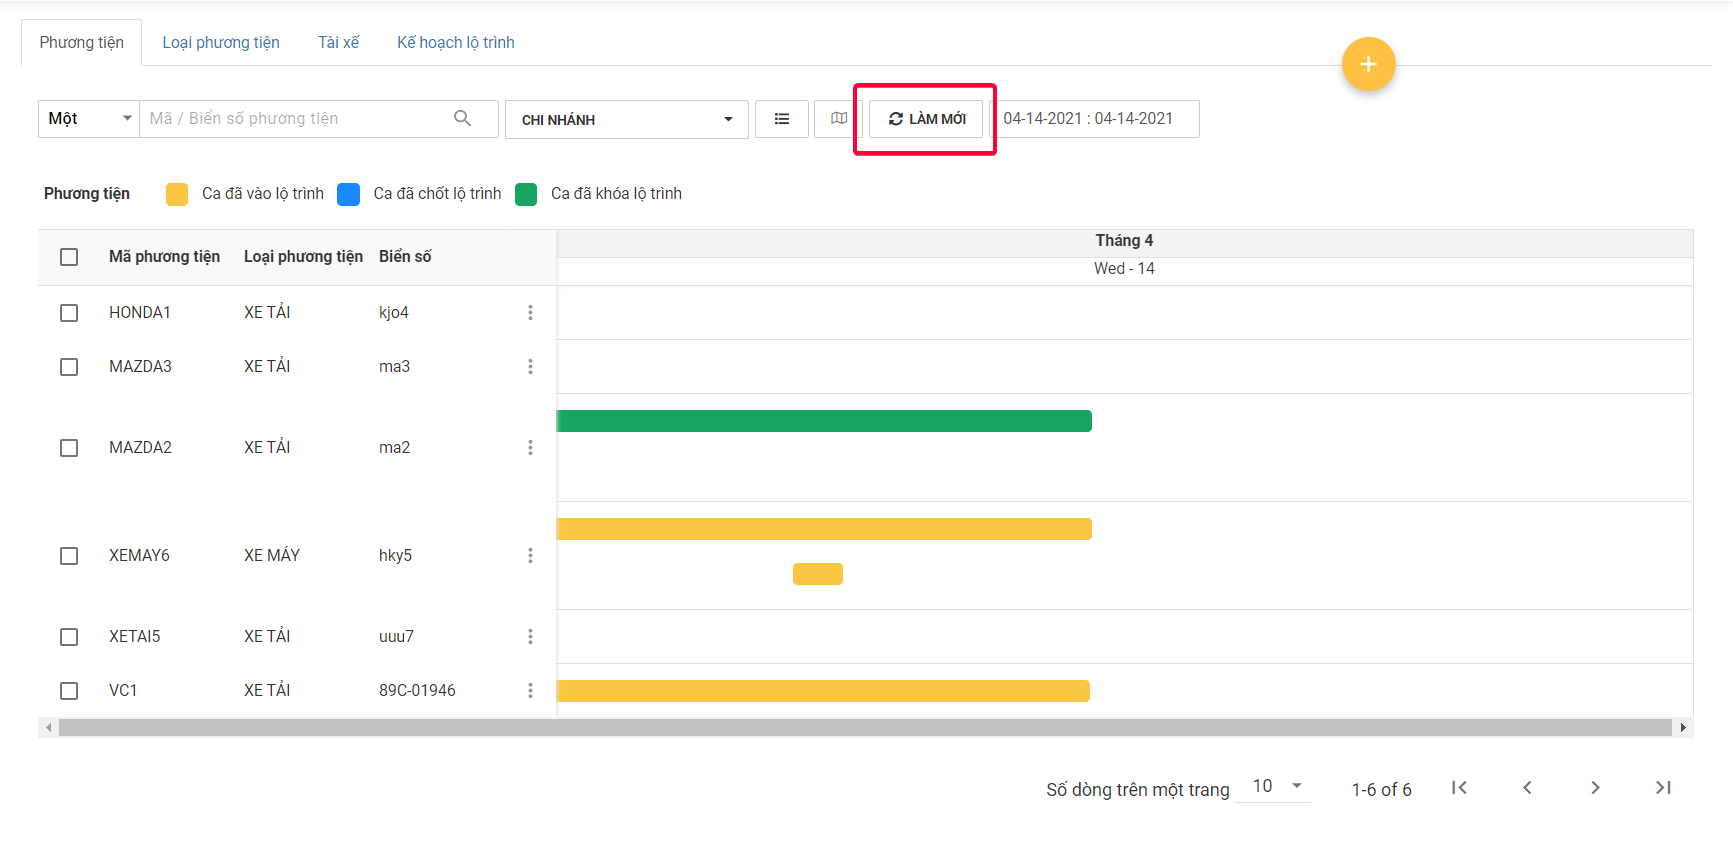
Illustration (Vietnamese)
Updated over 4 years ago
