Dashboards
This article is being updated
General steps
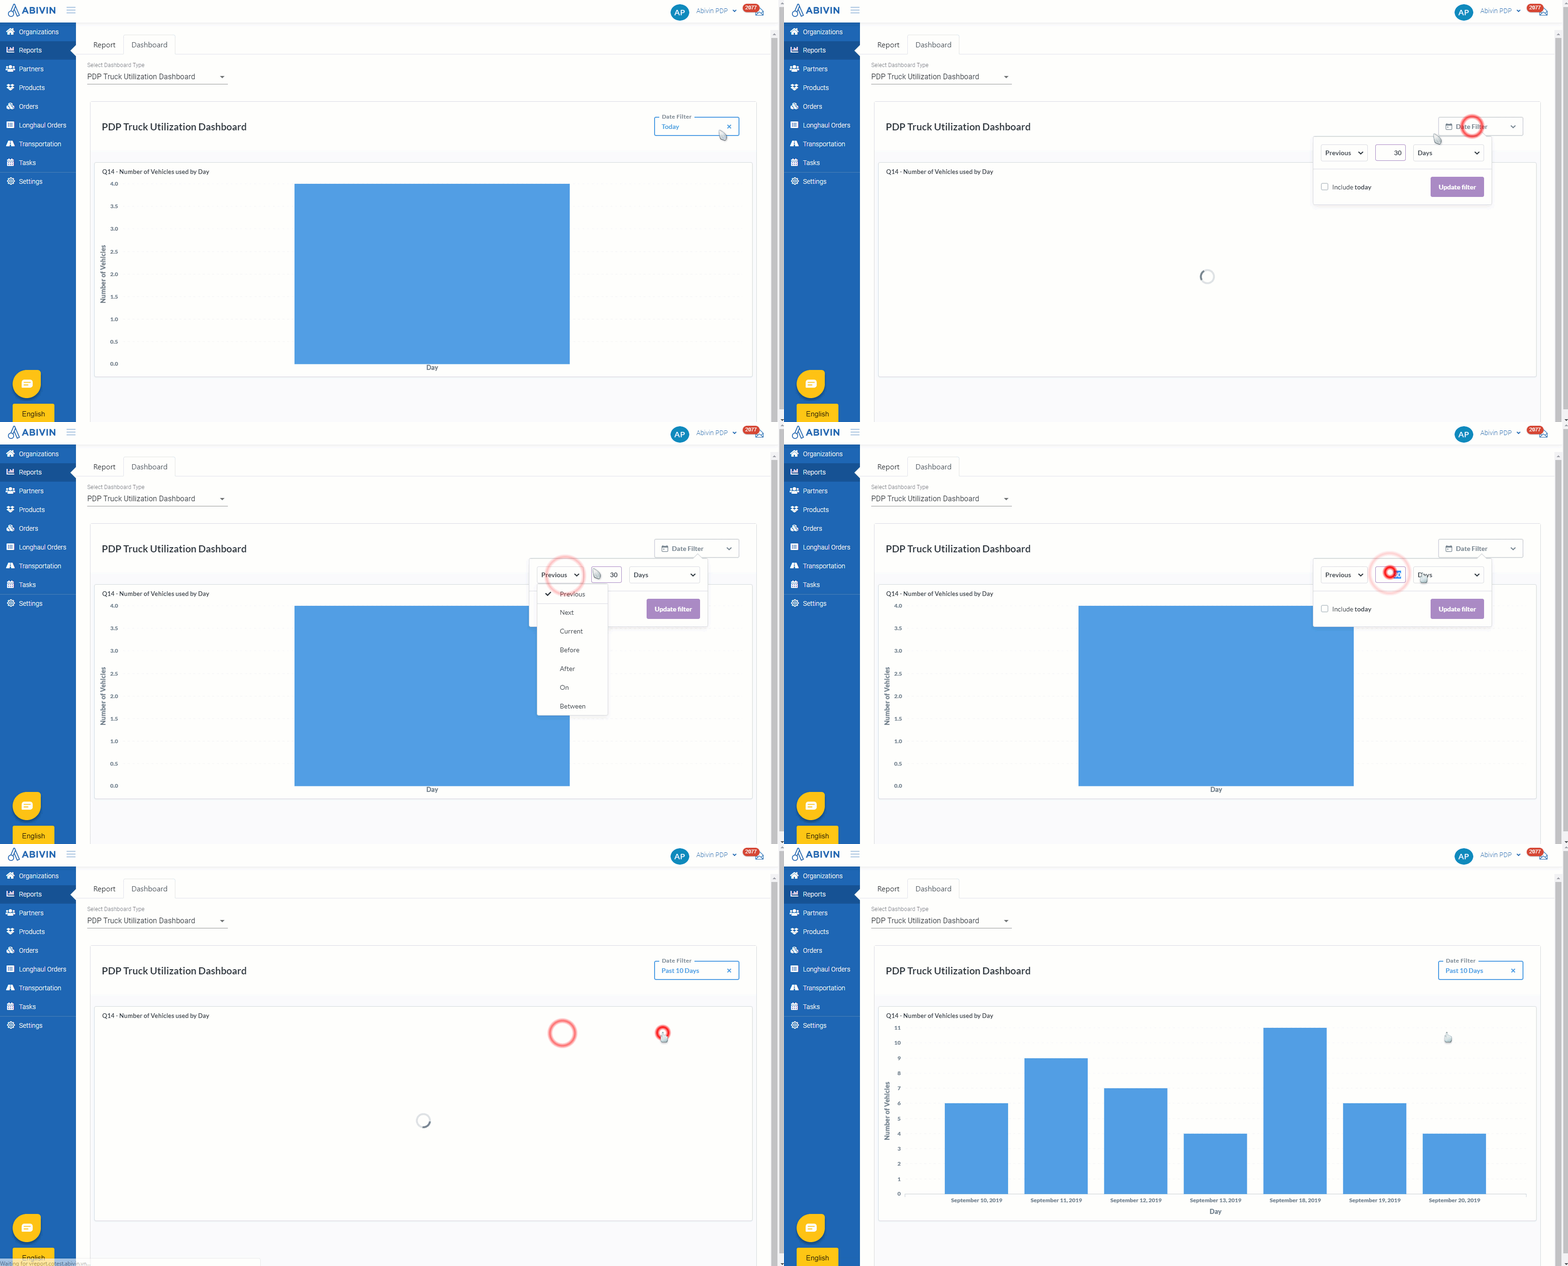
- Navigate to Reports > Dashboard tab
- Click on Select Dashboard Type field
- Select the dashboard from the drop down menu
- By default, all dashboards will show statistics of the present day
- Click on the Date filter field to filter the date range. There are various options: Previous [n] days, Next [n] days, Current day, Before [n] date, After [n] date, On [n] date, Between [n] and [m] dates
- After the date range is selected, click on Update filter. The system will automatically display the dashboard corresponding to that date range
Activities Time
Truck Utilization
- This dashboard will show the quantity of delivery trucks that have been utilized during a certain date range

On-time Delivery
- This dashboard will show the Total number of orders planned and performed during a date range, and specify the number of orders:
- That have been shipped
- That have not yet been shipped
- That have been delivered on time
Planned and Actual Resting/Stopping Hours
- This dashboard will show the Sum Planned Resting Stop Hours - Total number of hours the drivers are supposed to rest according to the generated route plan, and Sum Actual Resting Stop Hours - Total number of hours the drivers actually rested
Planned and Actual Driving Hours
- This dashboard will show the Sum Of Planned Driving Hours - Total number of hours the drivers are supposed to drive and load/unload at depots/warehouses according to the generated route plan, and Sum Of Actual Driving Hours - Total number of hours the drivers actually drove and loaded/unloaded at depots/warehouses
Updated almost 6 years ago
